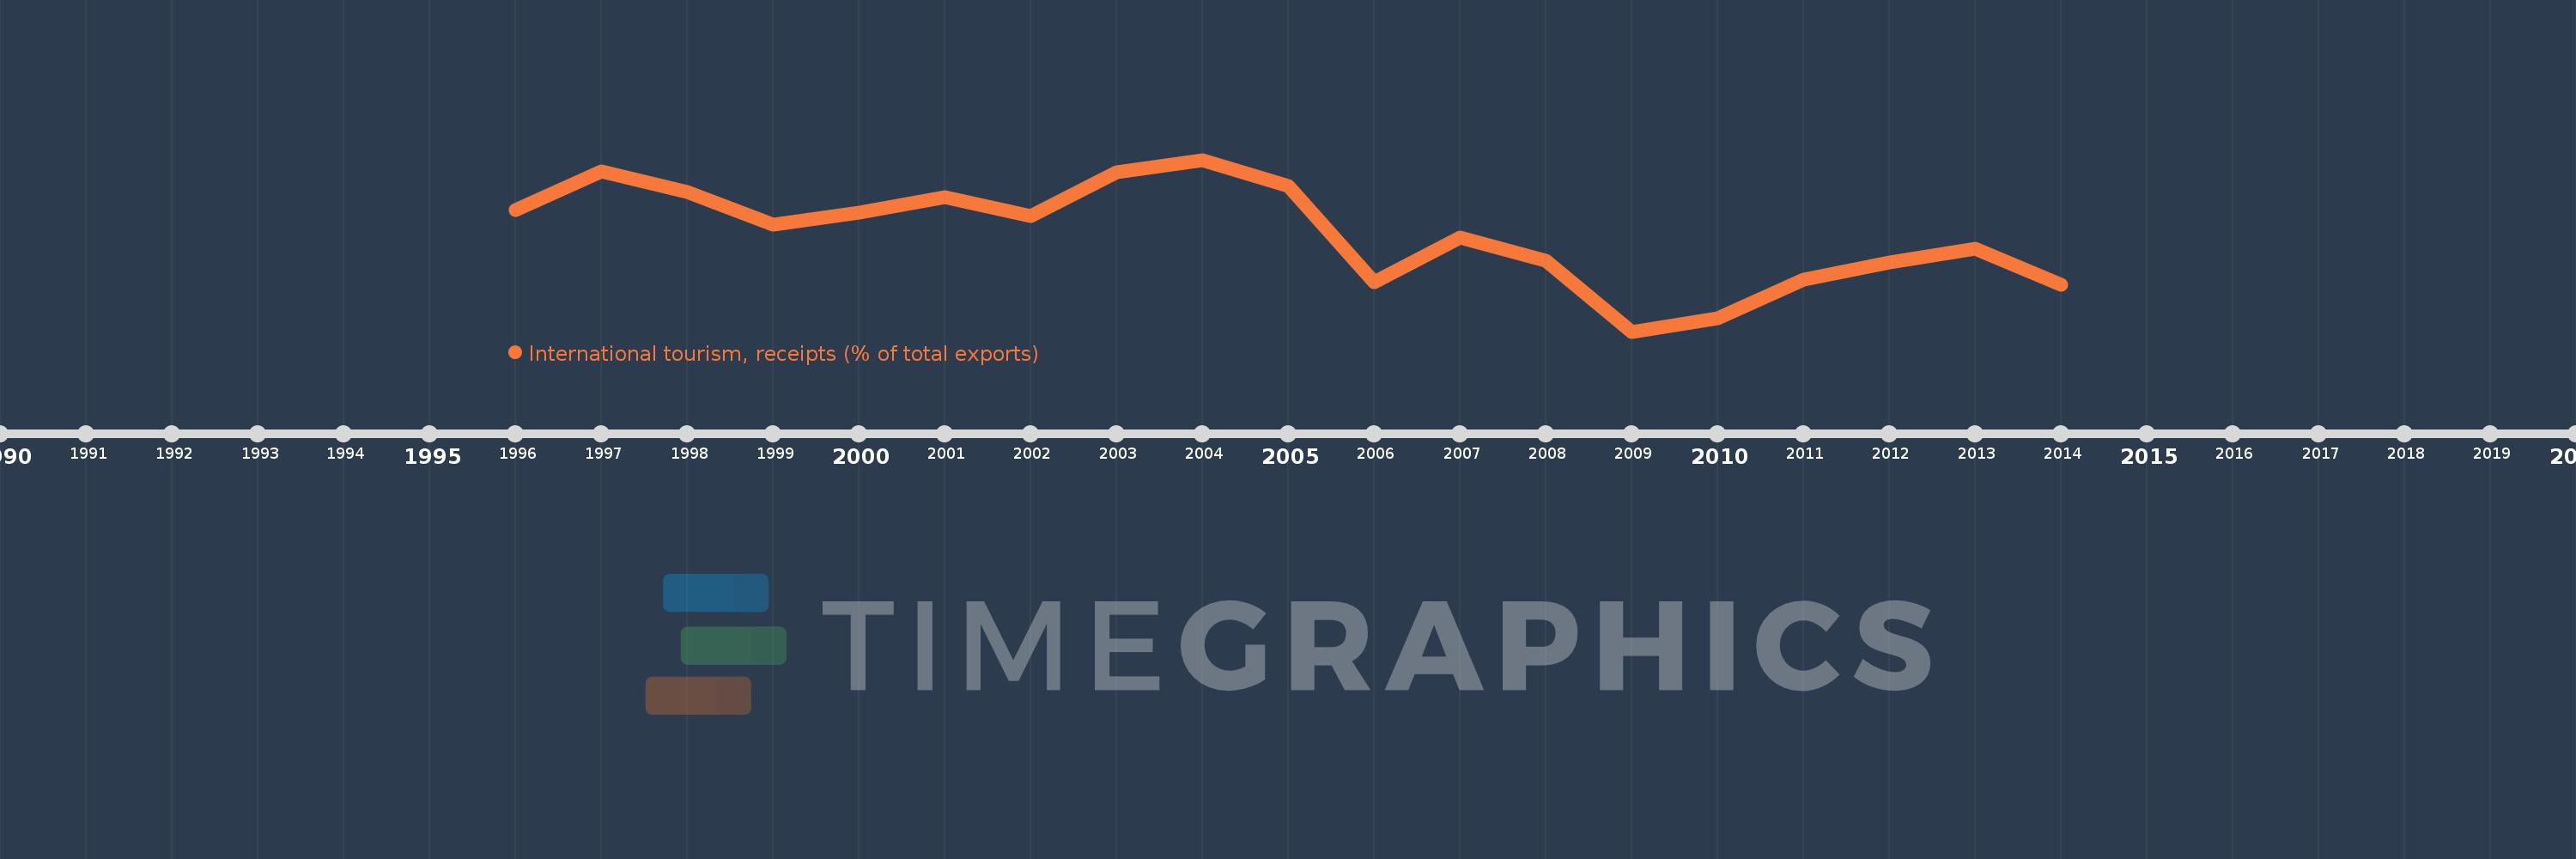
Questa scala temporale mostra un grafico dal 1996 anno al 2014 anno. Antigua and Barbuda. I dati fino ad 1995 anno non disponibili. Il numero di osservazioni attuali secondo i date: 19.
La fonte (nome):
Indicatori dello sviluppo mondiale
La fonte (organizzazione):
World Tourism Organization, Yearbook of Tourism Statistics, Compendium of Tourism Statistics and data files, and IMF and World Bank exports estimates.
Categorie:
Private Sector, Trade
sono stati aggiornati
23 apr 2017 anni
Indicatori delle variazioni dei valori per anni
In media:
59.899
Minima:
53.408
1 gen 2009 anni
Massimo:
64.846
1 gen 2004 anni
Alla data di osservazione
Valore
Variazione assoluta
La variazione rispetto al valore precedente
1 gen 1996 anni
61.503
+61.503
0.0%
1 gen 1997 anni
64.096
+2.593
4.22%
1 gen 1998 anni
62.713
-1.383
-2.16%
1 gen 1999 anni
60.528
-2.185
-3.48%
1 gen 2000 anni
61.333
+0.805
1.33%
1 gen 2001 anni
62.331
+0.999
1.63%
1 gen 2002 anni
61.078
-1.253
-2.01%
1 gen 2003 anni
64.039
+2.961
4.85%
1 gen 2004 anni
64.846
+0.807
1.26%
1 gen 2005 anni
63.112
-1.734
-2.67%
1 gen 2006 anni
56.669
-6.443
-10.21%
1 gen 2007 anni
59.653
+2.984
5.27%
1 gen 2008 anni
58.147
-1.506
-2.53%
1 gen 2009 anni
53.408
-4.738
-8.15%
1 gen 2010 anni
54.307
+0.898
1.68%
1 gen 2011 anni
56.888
+2.581
4.75%
1 gen 2012 anni
58.019
+1.131
1.99%
1 gen 2013 anni
58.905
+0.886
1.53%
1 gen 2014 anni
56.502
-2.403
-4.08%
Classificazione dei paesi secondo i statistiche attuali per anni