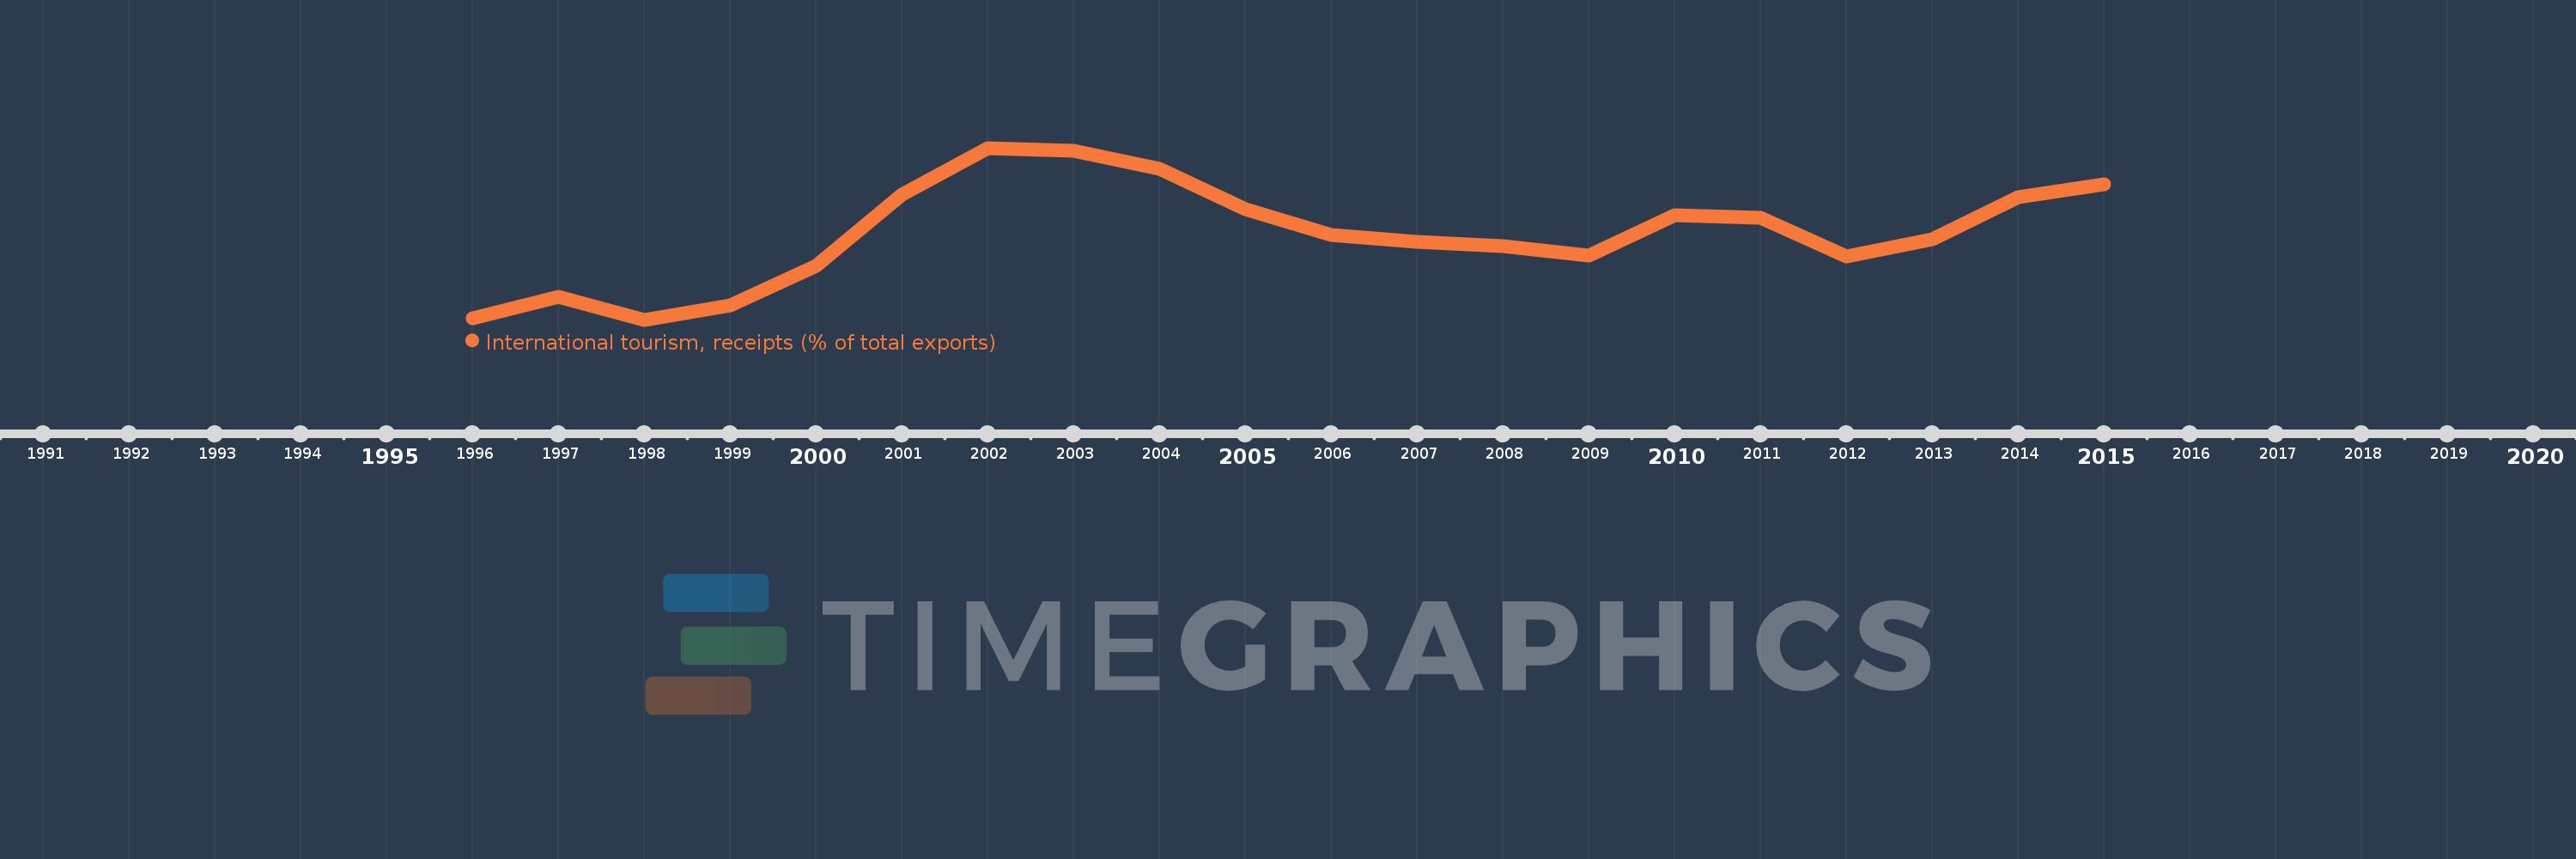
Questa scala temporale mostra un grafico dal 1996 anno al 2015 anno. Belarus. I dati fino ad 1995 anno non disponibili. Il numero di osservazioni attuali secondo i date: 20.
La fonte (nome):
Indicatori dello sviluppo mondiale
La fonte (organizzazione):
World Tourism Organization, Yearbook of Tourism Statistics, Compendium of Tourism Statistics and data files, and IMF and World Bank exports estimates.
Categorie:
Private Sector, Trade
sono stati aggiornati
23 apr 2017 anni
Indicatori delle variazioni dei valori per anni
In media:
2.002
Minima:
0.51
1 gen 1998 anni
Massimo:
3.472
1 gen 2002 anni
Alla data di osservazione
Valore
Variazione assoluta
La variazione rispetto al valore precedente
1 gen 1996 anni
0.531
+0.531
0.0%
1 gen 1997 anni
0.911
+0.379
71.38%
1 gen 1998 anni
0.51
-0.4
-43.96%
1 gen 1999 anni
0.761
+0.25
49.08%
1 gen 2000 anni
1.438
+0.677
88.94%
1 gen 2001 anni
2.667
+1.23
85.56%
1 gen 2002 anni
3.472
+0.805
30.17%
1 gen 2003 anni
3.429
-0.044
-1.26%
1 gen 2004 anni
3.115
-0.313
-9.13%
1 gen 2005 anni
2.417
-0.698
-22.42%
1 gen 2006 anni
1.973
-0.444
-18.37%
1 gen 2007 anni
1.859
-0.114
-5.77%
1 gen 2008 anni
1.784
-0.075
-4.05%
1 gen 2009 anni
1.615
-0.169
-9.45%
1 gen 2010 anni
2.316
+0.701
43.38%
1 gen 2011 anni
2.269
-0.046
-2.0%
1 gen 2012 anni
1.605
-0.664
-29.27%
1 gen 2013 anni
1.9
+0.295
18.39%
1 gen 2014 anni
2.625
+0.724
38.11%
1 gen 2015 anni
2.84
+0.216
8.23%
Classificazione dei paesi secondo i statistiche attuali per anni