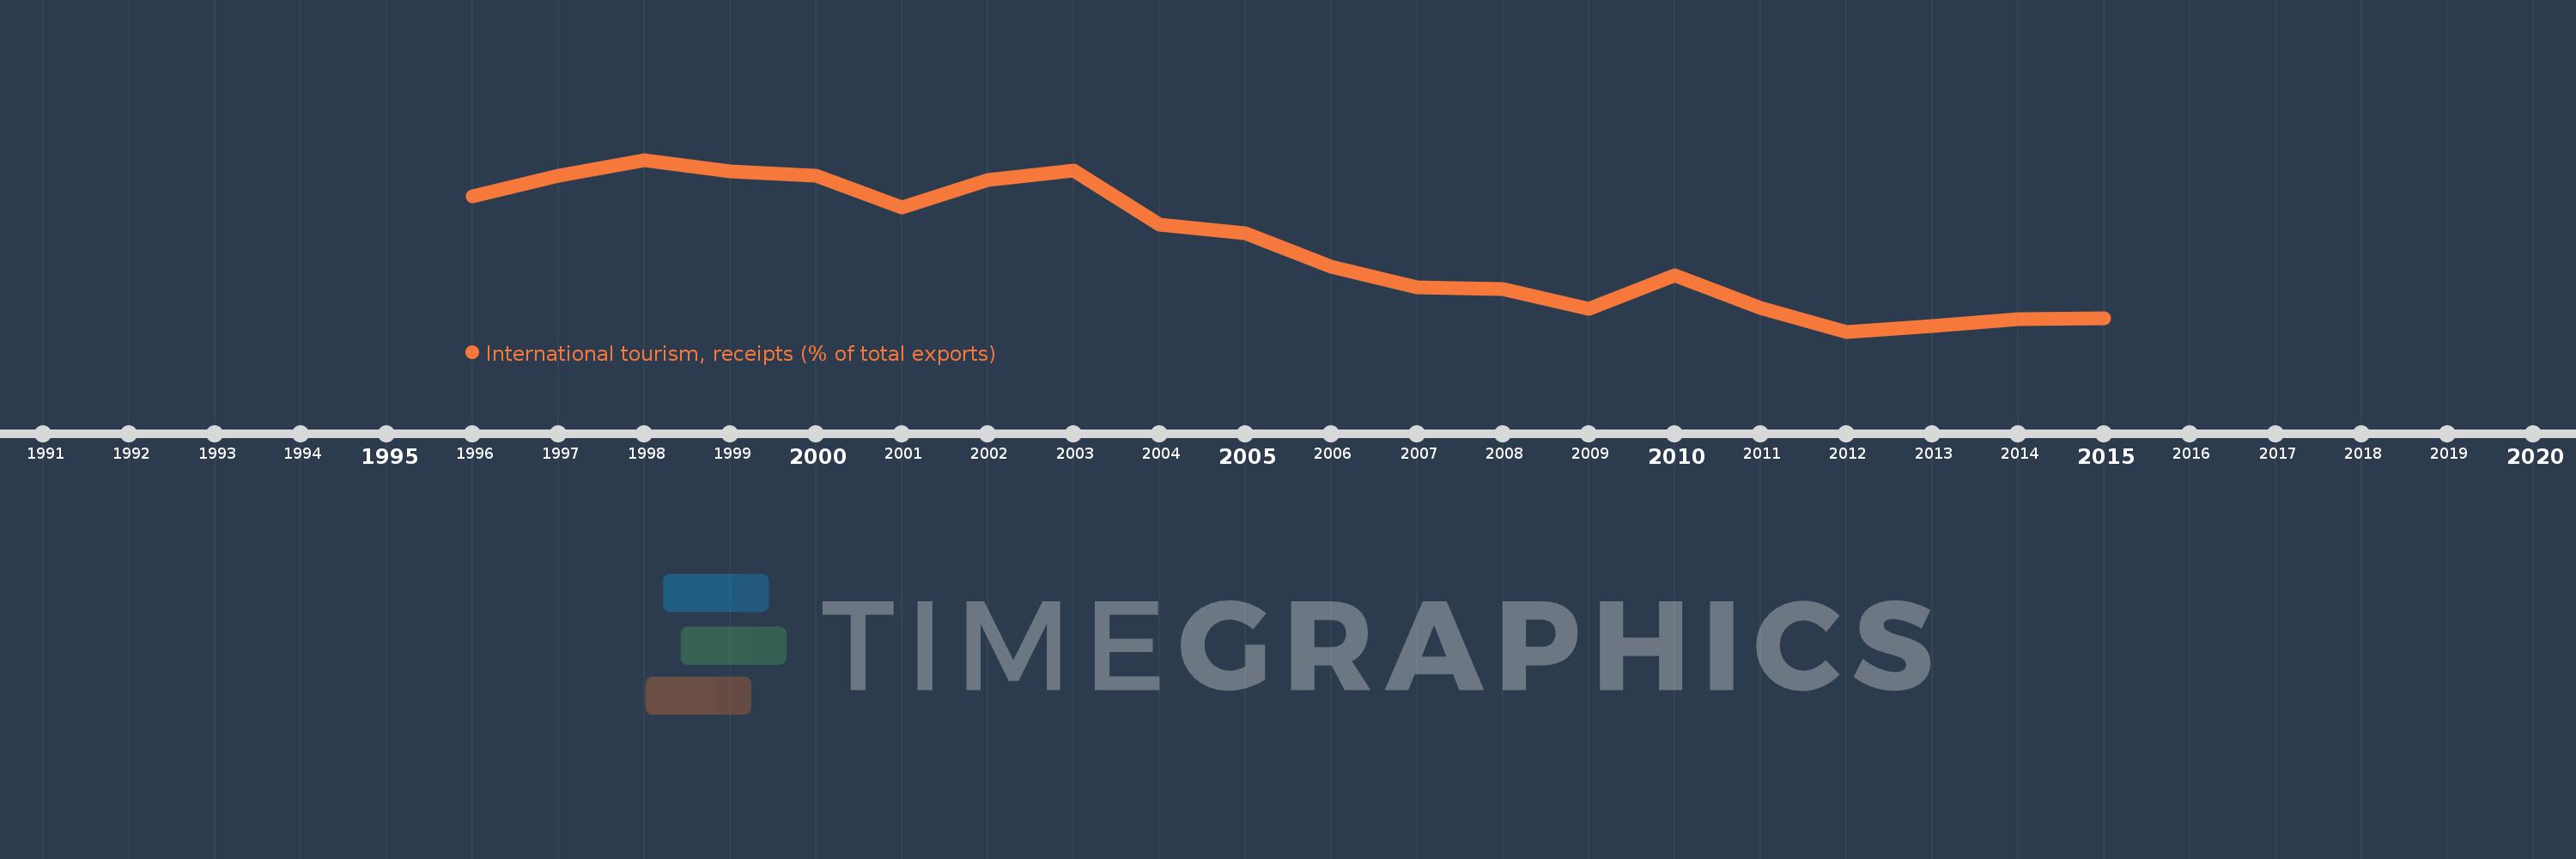
Questa scala temporale mostra un grafico dal 1996 anno al 2015 anno. IBRD only. I dati fino ad 1995 anno non disponibili. Il numero di osservazioni attuali secondo i date: 20.
La fonte (nome):
Indicatori dello sviluppo mondiale
La fonte (organizzazione):
World Tourism Organization, Yearbook of Tourism Statistics, Compendium of Tourism Statistics and data files, and IMF and World Bank exports estimates.
Categorie:
Private Sector, Trade
sono stati aggiornati
23 apr 2017 anni
Indicatori delle variazioni dei valori per anni
In media:
7.219
Minima:
5.081
1 gen 2012 anni
Massimo:
9.39
1 gen 1998 anni
Alla data di osservazione
Valore
Variazione assoluta
La variazione rispetto al valore precedente
1 gen 1996 anni
8.481
+8.481
0.0%
1 gen 1997 anni
8.992
+0.511
6.03%
1 gen 1998 anni
9.39
+0.398
4.43%
1 gen 1999 anni
9.106
-0.284
-3.03%
1 gen 2000 anni
8.988
-0.117
-1.29%
1 gen 2001 anni
8.184
-0.804
-8.94%
1 gen 2002 anni
8.879
+0.694
8.48%
1 gen 2003 anni
9.118
+0.239
2.69%
1 gen 2004 anni
7.756
-1.362
-14.94%
1 gen 2005 anni
7.54
-0.216
-2.79%
1 gen 2006 anni
6.7
-0.839
-11.13%
1 gen 2007 anni
6.19
-0.51
-7.62%
1 gen 2008 anni
6.158
-0.032
-0.52%
1 gen 2009 anni
5.642
-0.516
-8.38%
1 gen 2010 anni
6.491
+0.85
15.06%
1 gen 2011 anni
5.672
-0.819
-12.62%
1 gen 2012 anni
5.081
-0.59
-10.41%
1 gen 2013 anni
5.215
+0.134
2.64%
1 gen 2014 anni
5.383
+0.167
3.21%
1 gen 2015 anni
5.414
+0.031
0.58%
Classificazione dei paesi secondo i statistiche attuali per anni