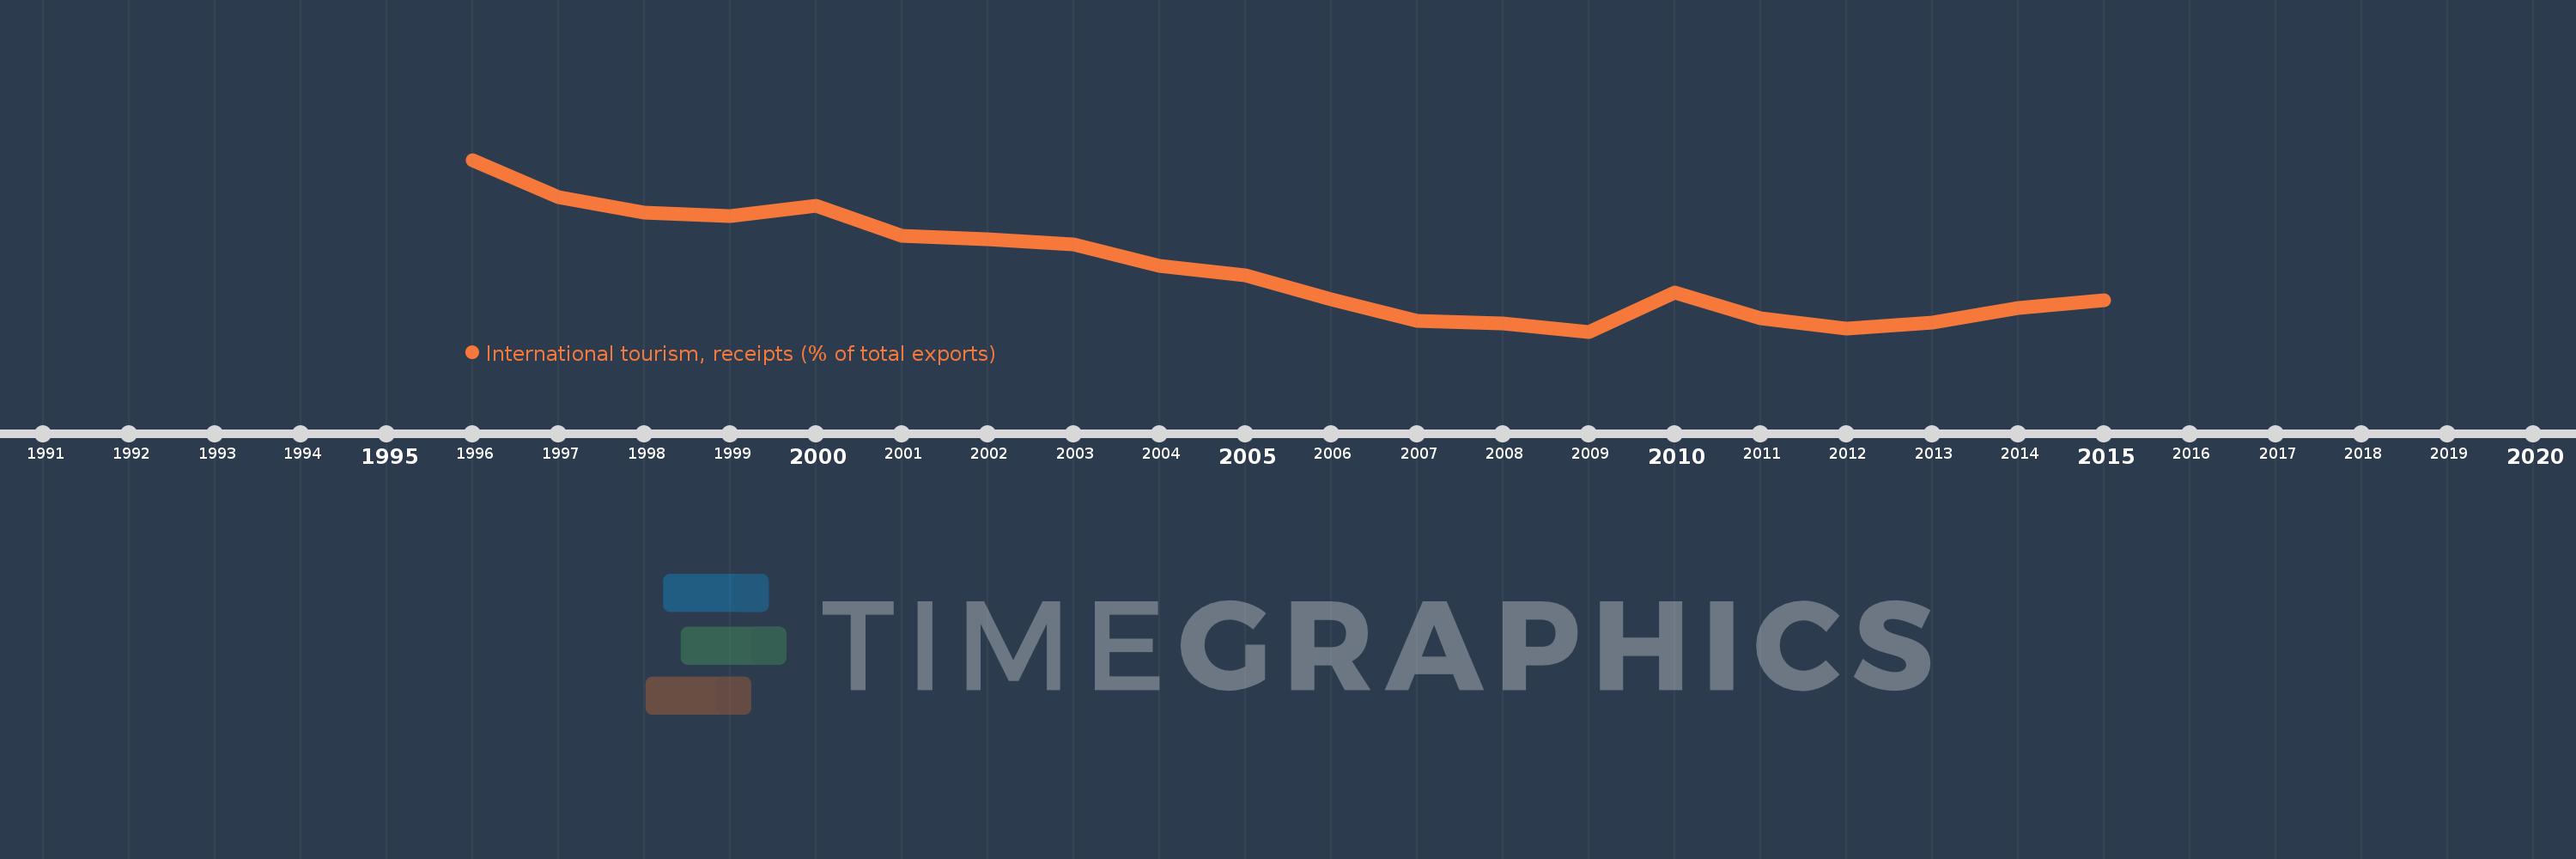
Questa scala temporale mostra un grafico dal 1996 anno al 2015 anno. High income. I dati fino ad 1995 anno non disponibili. Il numero di osservazioni attuali secondo i date: 20.
La fonte (nome):
Indicatori dello sviluppo mondiale
La fonte (organizzazione):
World Tourism Organization, Yearbook of Tourism Statistics, Compendium of Tourism Statistics and data files, and IMF and World Bank exports estimates.
Categorie:
Private Sector, Trade
sono stati aggiornati
23 apr 2017 anni
Indicatori delle variazioni dei valori per anni
In media:
6.742
Minima:
5.723
1 gen 2009 anni
Massimo:
8.563
1 gen 1996 anni
Alla data di osservazione
Valore
Variazione assoluta
La variazione rispetto al valore precedente
1 gen 1996 anni
8.563
+8.563
0.0%
1 gen 1997 anni
7.94
-0.623
-7.28%
1 gen 1998 anni
7.685
-0.255
-3.21%
1 gen 1999 anni
7.629
-0.056
-0.73%
1 gen 2000 anni
7.801
+0.172
2.26%
1 gen 2001 anni
7.303
-0.498
-6.39%
1 gen 2002 anni
7.245
-0.058
-0.8%
1 gen 2003 anni
7.165
-0.079
-1.1%
1 gen 2004 anni
6.814
-0.351
-4.9%
1 gen 2005 anni
6.659
-0.156
-2.28%
1 gen 2006 anni
6.256
-0.403
-6.05%
1 gen 2007 anni
5.894
-0.362
-5.79%
1 gen 2008 anni
5.858
-0.036
-0.61%
1 gen 2009 anni
5.723
-0.135
-2.31%
1 gen 2010 anni
6.365
+0.642
11.22%
1 gen 2011 anni
5.938
-0.427
-6.71%
1 gen 2012 anni
5.77
-0.168
-2.83%
1 gen 2013 anni
5.879
+0.109
1.9%
1 gen 2014 anni
6.116
+0.237
4.03%
1 gen 2015 anni
6.246
+0.13
2.12%
Classificazione dei paesi secondo i statistiche attuali per anni