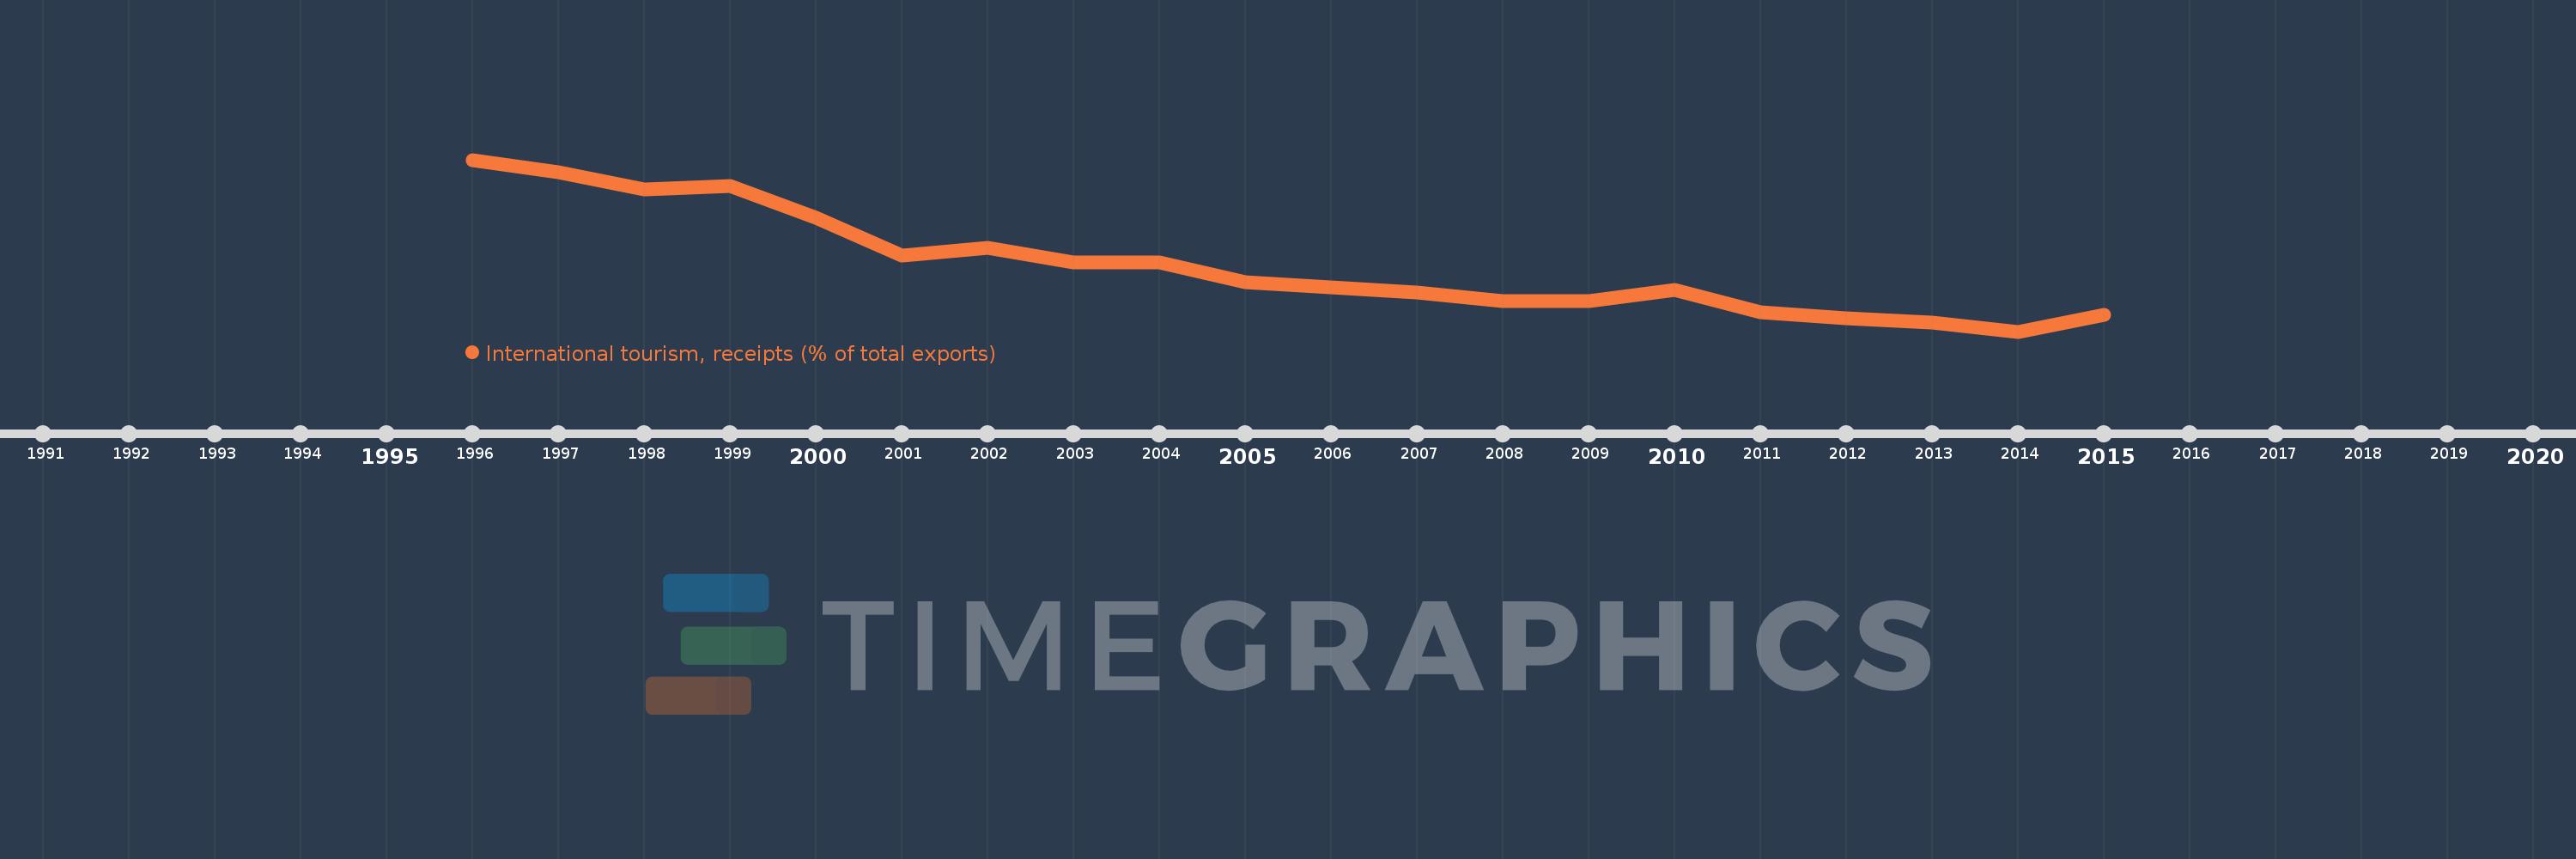
Questa scala temporale mostra un grafico dal 1996 anno al 2015 anno. Switzerland. I dati fino ad 1995 anno non disponibili. Il numero di osservazioni attuali secondo i date: 20.
La fonte (nome):
Indicatori dello sviluppo mondiale
La fonte (organizzazione):
World Tourism Organization, Yearbook of Tourism Statistics, Compendium of Tourism Statistics and data files, and IMF and World Bank exports estimates.
Categorie:
Private Sector, Trade
sono stati aggiornati
23 apr 2017 anni
Indicatori delle variazioni dei valori per anni
In media:
6.109
Minima:
4.168
1 gen 2014 anni
Massimo:
9.207
1 gen 1996 anni
Alla data di osservazione
Valore
Variazione assoluta
La variazione rispetto al valore precedente
1 gen 1996 anni
9.207
+9.207
0.0%
1 gen 1997 anni
8.839
-0.368
-4.0%
1 gen 1998 anni
8.331
-0.508
-5.74%
1 gen 1999 anni
8.446
+0.114
1.37%
1 gen 2000 anni
7.515
-0.93
-11.02%
1 gen 2001 anni
6.402
-1.114
-14.82%
1 gen 2002 anni
6.631
+0.23
3.59%
1 gen 2003 anni
6.19
-0.441
-6.65%
1 gen 2004 anni
6.185
-0.005
-0.08%
1 gen 2005 anni
5.609
-0.575
-9.3%
1 gen 2006 anni
5.453
-0.156
-2.78%
1 gen 2007 anni
5.302
-0.151
-2.78%
1 gen 2008 anni
5.054
-0.248
-4.69%
1 gen 2009 anni
5.056
+0.002
0.04%
1 gen 2010 anni
5.397
+0.341
6.75%
1 gen 2011 anni
4.734
-0.663
-12.29%
1 gen 2012 anni
4.552
-0.182
-3.84%
1 gen 2013 anni
4.44
-0.112
-2.46%
1 gen 2014 anni
4.168
-0.272
-6.13%
1 gen 2015 anni
4.665
+0.497
11.93%
Classificazione dei paesi secondo i statistiche attuali per anni