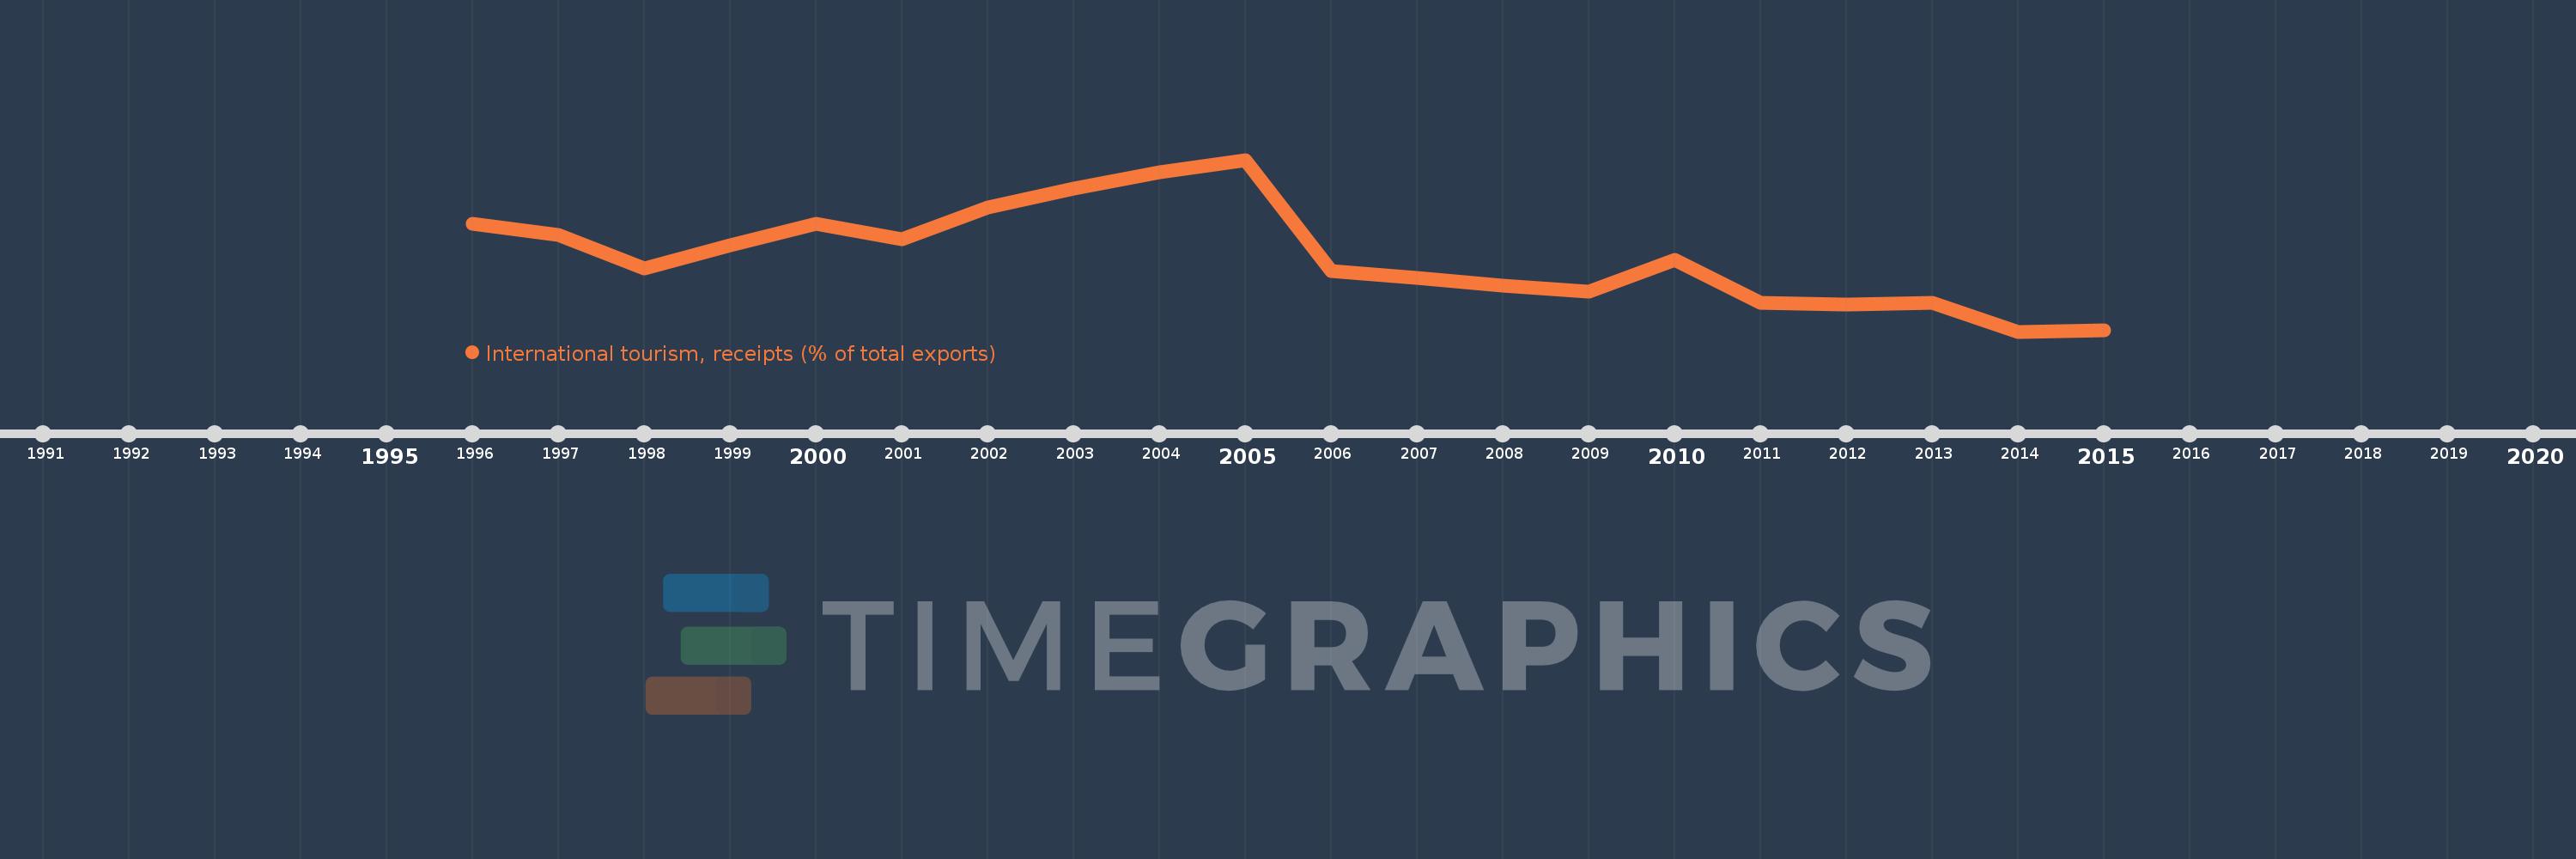
Questa scala temporale mostra un grafico dal 1996 anno al 2015 anno. Low income. I dati fino ad 1995 anno non disponibili. Il numero di osservazioni attuali secondo i date: 20.
La fonte (nome):
Indicatori dello sviluppo mondiale
La fonte (organizzazione):
World Tourism Organization, Yearbook of Tourism Statistics, Compendium of Tourism Statistics and data files, and IMF and World Bank exports estimates.
Categorie:
Private Sector, Trade
sono stati aggiornati
23 apr 2017 anni
Indicatori delle variazioni dei valori per anni
In media:
15.407
Minima:
12.055
1 gen 2014 anni
Massimo:
19.673
1 gen 2005 anni
Alla data di osservazione
Valore
Variazione assoluta
La variazione rispetto al valore precedente
1 gen 1996 anni
16.851
+16.851
0.0%
1 gen 1997 anni
16.327
-0.525
-3.12%
1 gen 1998 anni
14.854
-1.472
-9.02%
1 gen 1999 anni
15.901
+1.047
7.05%
1 gen 2000 anni
16.854
+0.953
5.99%
1 gen 2001 anni
16.147
-0.707
-4.19%
1 gen 2002 anni
17.544
+1.397
8.65%
1 gen 2003 anni
18.407
+0.863
4.92%
1 gen 2004 anni
19.135
+0.728
3.96%
1 gen 2005 anni
19.673
+0.537
2.81%
1 gen 2006 anni
14.737
-4.936
-25.09%
1 gen 2007 anni
14.443
-0.295
-2.0%
1 gen 2008 anni
14.11
-0.333
-2.31%
1 gen 2009 anni
13.822
-0.288
-2.04%
1 gen 2010 anni
15.247
+1.425
10.31%
1 gen 2011 anni
13.32
-1.927
-12.64%
1 gen 2012 anni
13.262
-0.058
-0.44%
1 gen 2013 anni
13.336
+0.074
0.56%
1 gen 2014 anni
12.055
-1.281
-9.6%
1 gen 2015 anni
12.106
+0.051
0.43%
Classificazione dei paesi secondo i statistiche attuali per anni