Questa scala temporale mostra un grafico dal 1996 anno al 2015 anno. IDA & IBRD total. I dati fino ad 1995 anno non disponibili. Il numero di osservazioni attuali secondo i date: 20.
La fonte (nome):
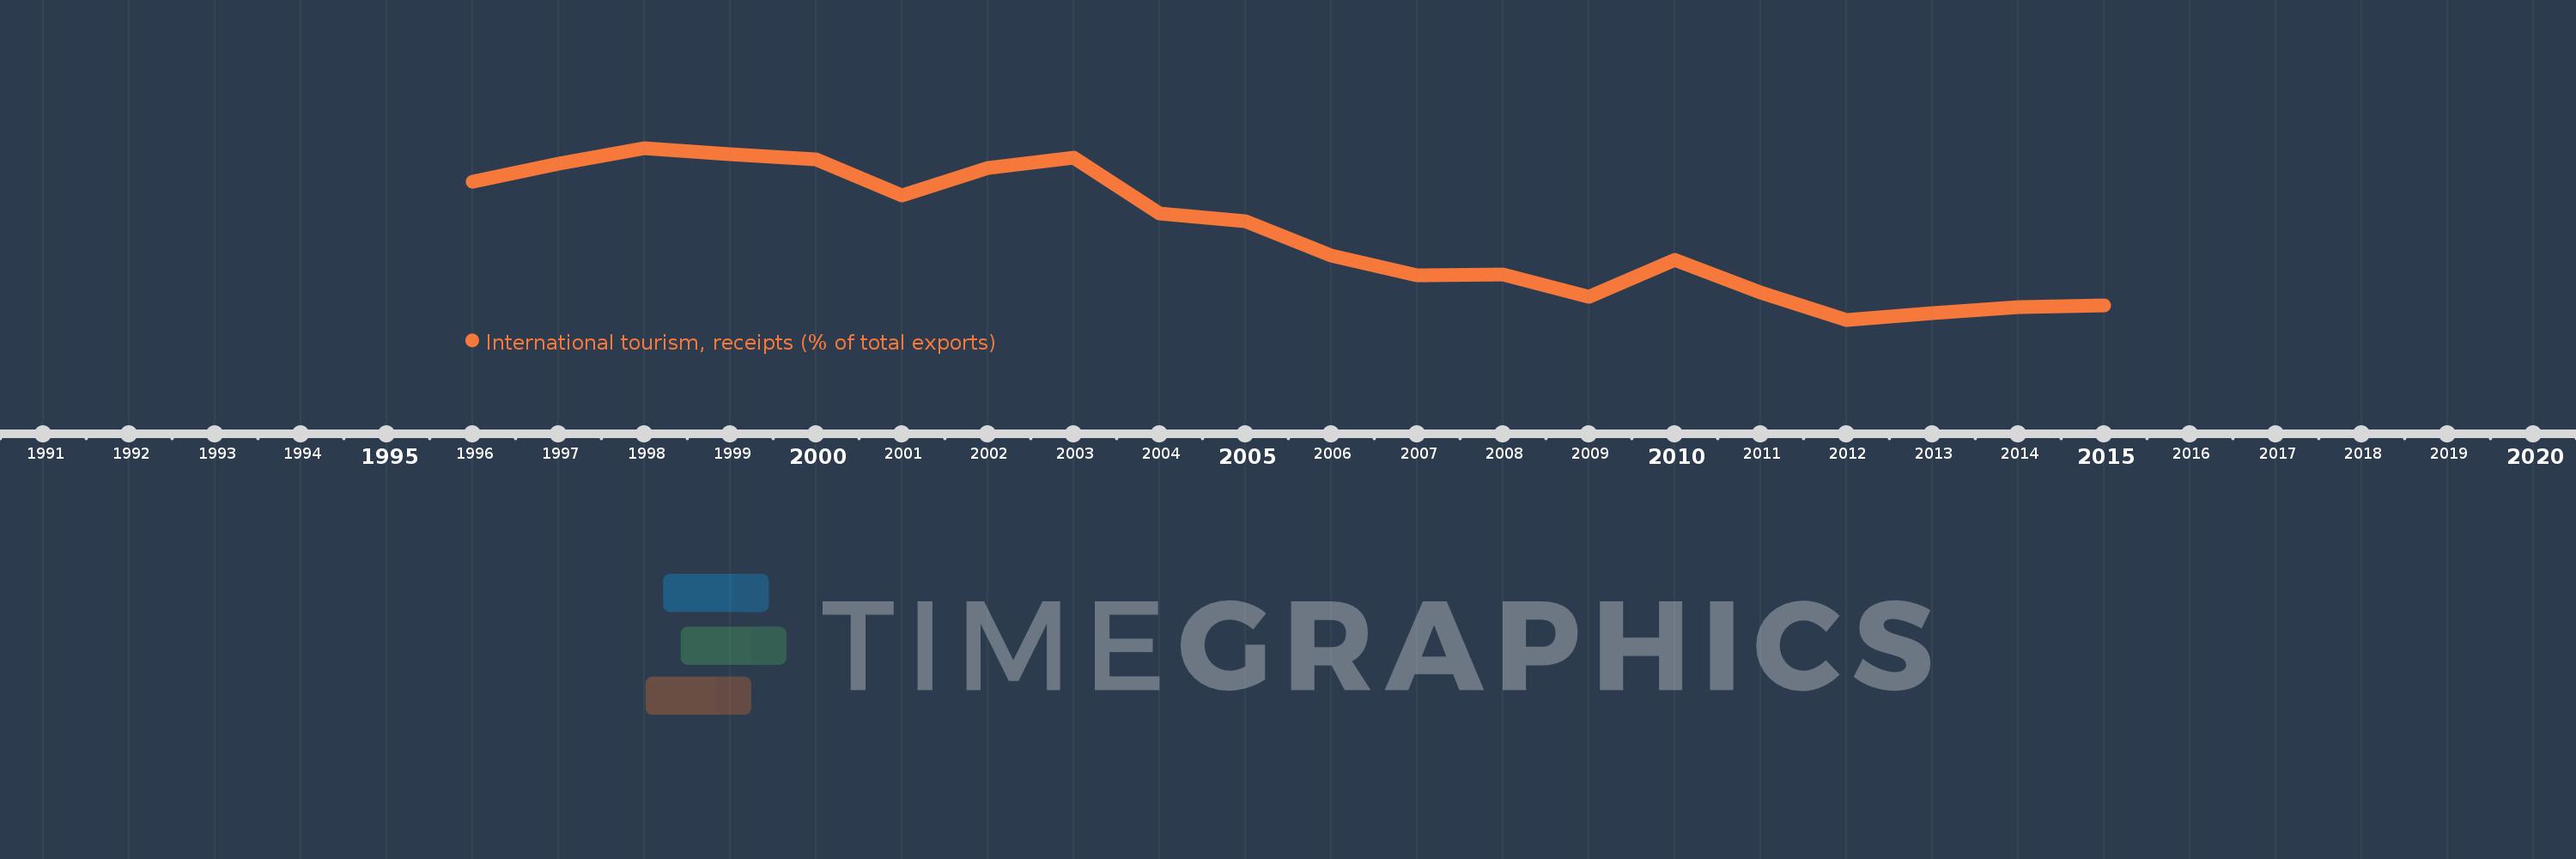
Indicatori dello sviluppo mondiale
La fonte (organizzazione):
World Tourism Organization, Yearbook of Tourism Statistics, Compendium of Tourism Statistics and data files, and IMF and World Bank exports estimates.
Categorie:
Private Sector, Trade
sono stati aggiornati
23 apr 2017 anni
Indicatori delle variazioni dei valori per anni
In media:
7.273
Minima:
5.183
1 gen 2012 anni
Massimo:
9.33
1 gen 1998 anni
Alla data di osservazione
Valore
Variazione assoluta
La variazione rispetto al valore precedente
1 gen 1996 anni
8.515
+8.515
0.0%
1 gen 1997 anni
8.957
+0.442
5.19%
1 gen 1998 anni
9.33
+0.372
4.16%
1 gen 1999 anni
9.176
-0.154
-1.65%
1 gen 2000 anni
9.055
-0.121
-1.32%
1 gen 2001 anni
8.176
-0.879
-9.71%
1 gen 2002 anni
8.85
+0.675
8.25%
1 gen 2003 anni
9.096
+0.246
2.78%
1 gen 2004 anni
7.748
-1.348
-14.81%
1 gen 2005 anni
7.563
-0.185
-2.39%
1 gen 2006 anni
6.733
-0.83
-10.97%
1 gen 2007 anni
6.261
-0.472
-7.02%
1 gen 2008 anni
6.266
+0.006
0.09%
1 gen 2009 anni
5.744
-0.522
-8.34%
1 gen 2010 anni
6.618
+0.874
15.22%
1 gen 2011 anni
5.836
-0.782
-11.82%
1 gen 2012 anni
5.183
-0.654
-11.2%
1 gen 2013 anni
5.344
+0.161
3.11%
1 gen 2014 anni
5.492
+0.148
2.77%
1 gen 2015 anni
5.526
+0.034
0.63%
Classificazione dei paesi secondo i statistiche attuali per anni