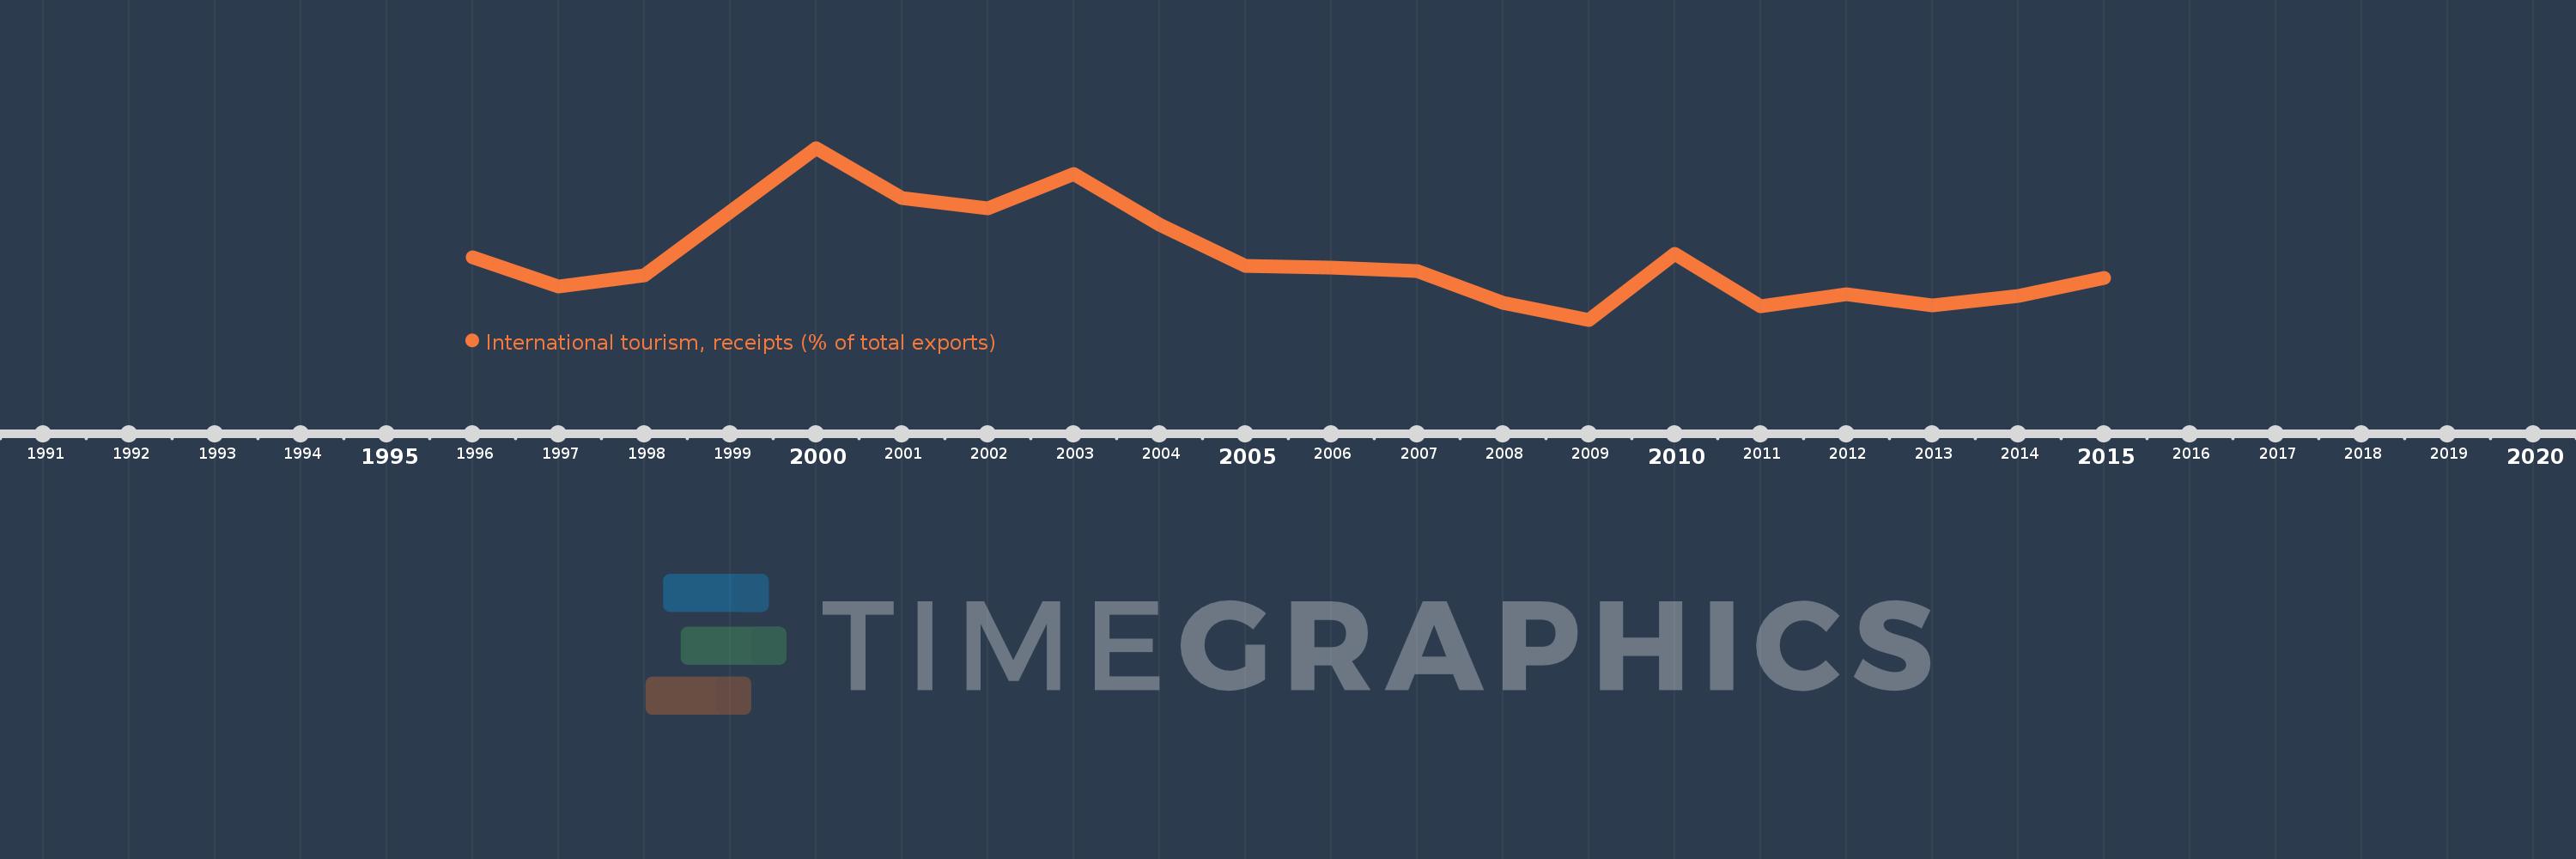
Questa scala temporale mostra un grafico dal 1996 anno al 2015 anno. Greece. I dati fino ad 1995 anno non disponibili. Il numero di osservazioni attuali secondo i date: 19.
La fonte (nome):
Indicatori dello sviluppo mondiale
La fonte (organizzazione):
World Tourism Organization, Yearbook of Tourism Statistics, Compendium of Tourism Statistics and data files, and IMF and World Bank exports estimates.
Categorie:
Private Sector, Trade
sono stati aggiornati
23 apr 2017 anni
Indicatori delle variazioni dei valori per anni
In media:
26.736
Minima:
22.095
1 gen 2009 anni
Massimo:
35.363
1 gen 2000 anni
Alla data di osservazione
Valore
Variazione assoluta
La variazione rispetto al valore precedente
1 gen 1996 anni
26.941
+26.941
0.0%
1 gen 1997 anni
24.669
-2.272
-8.43%
1 gen 1998 anni
25.526
+0.858
3.48%
1 gen 2000 anni
35.363
+9.836
38.53%
1 gen 2001 anni
31.498
-3.865
-10.93%
1 gen 2002 anni
30.679
-0.818
-2.6%
1 gen 2003 anni
33.372
+2.693
8.78%
1 gen 2004 anni
29.429
-3.943
-11.81%
1 gen 2005 anni
26.244
-3.186
-10.82%
1 gen 2006 anni
26.111
-0.132
-0.5%
1 gen 2007 anni
25.87
-0.242
-0.93%
1 gen 2008 anni
23.399
-2.47
-9.55%
1 gen 2009 anni
22.095
-1.304
-5.57%
1 gen 2010 anni
27.154
+5.059
22.9%
1 gen 2011 anni
23.129
-4.025
-14.82%
1 gen 2012 anni
24.039
+0.91
3.94%
1 gen 2013 anni
23.199
-0.84
-3.49%
1 gen 2014 anni
23.916
+0.716
3.09%
1 gen 2015 anni
25.357
+1.441
6.03%
Classificazione dei paesi secondo i statistiche attuali per anni