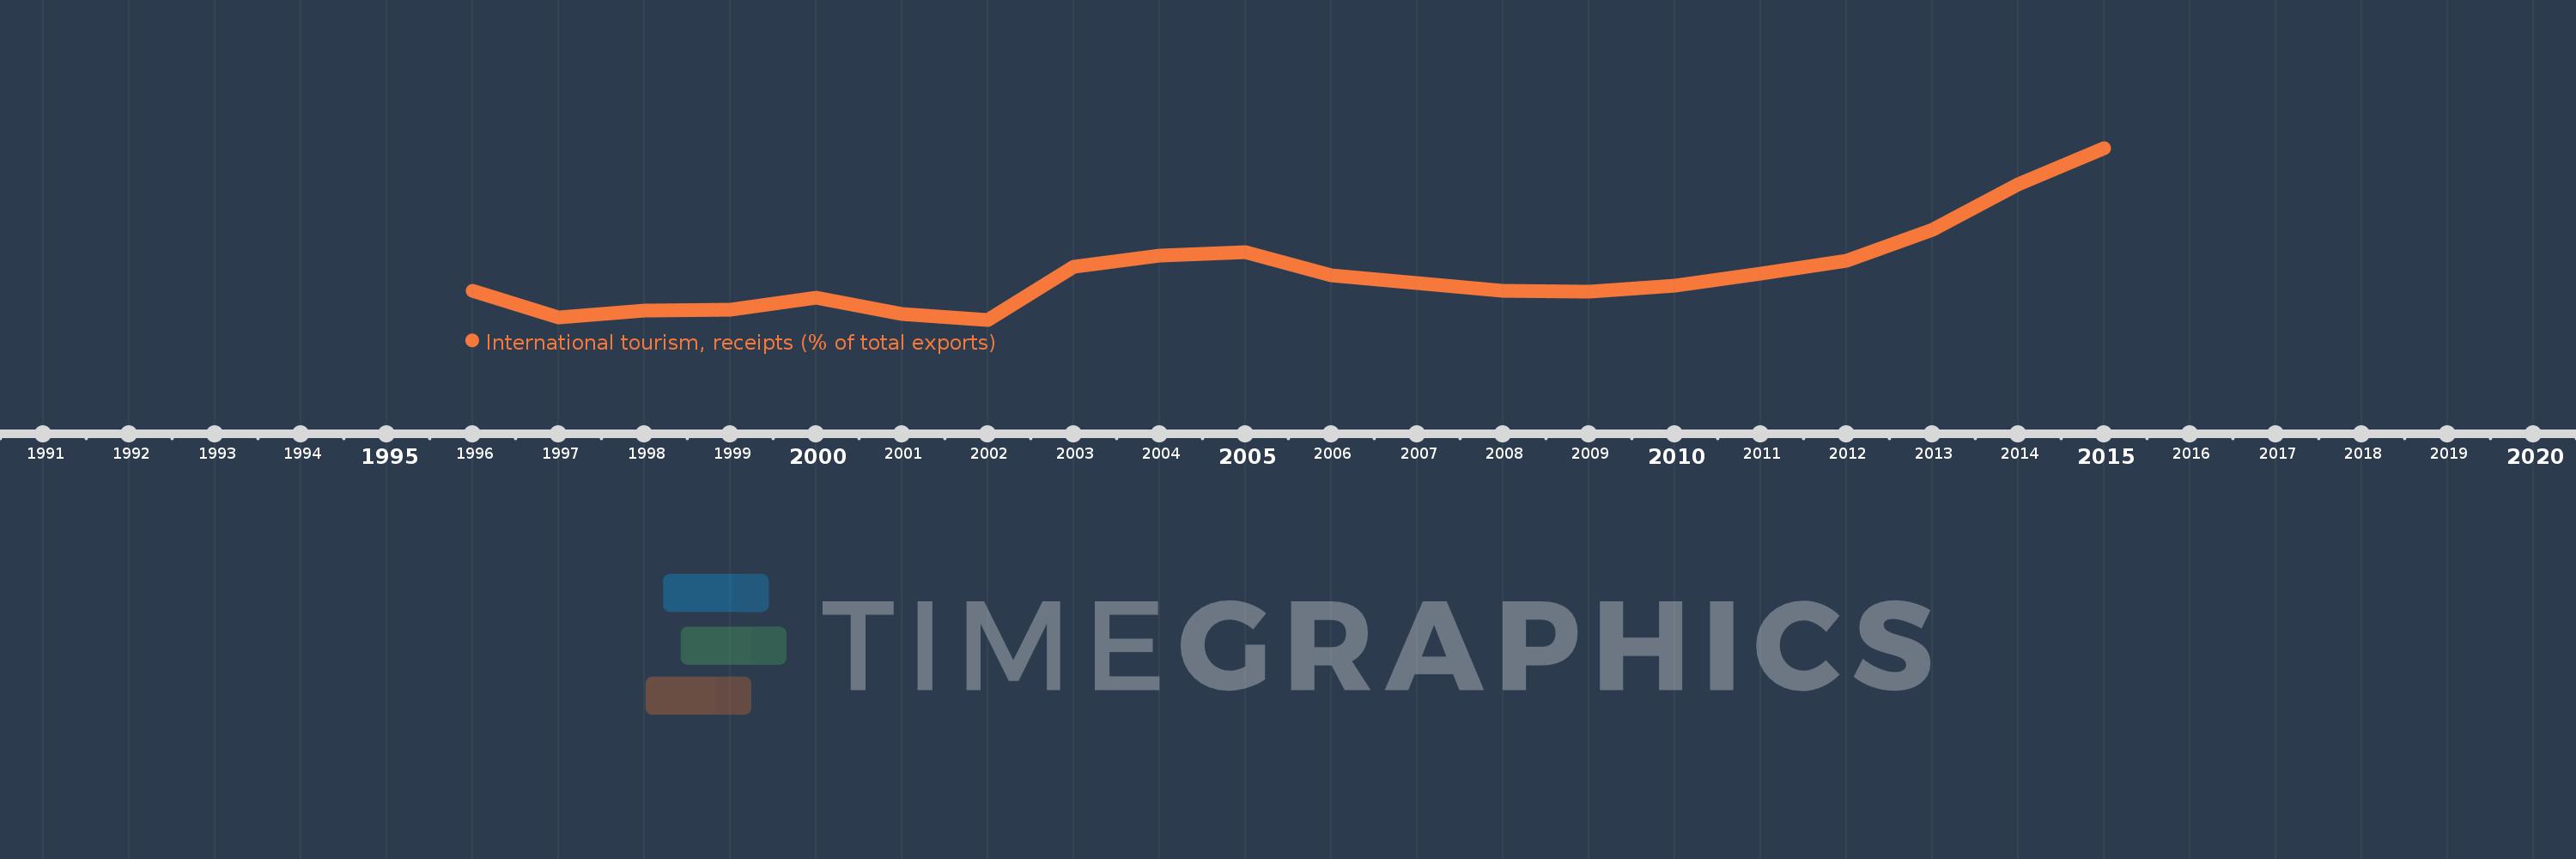
Questa scala temporale mostra un grafico dal 1996 anno al 2015 anno. Sri Lanka. I dati fino ad 1995 anno non disponibili. Il numero di osservazioni attuali secondo i date: 20.
La fonte (nome):
Indicatori dello sviluppo mondiale
La fonte (organizzazione):
World Tourism Organization, Yearbook of Tourism Statistics, Compendium of Tourism Statistics and data files, and IMF and World Bank exports estimates.
Categorie:
Private Sector, Trade
sono stati aggiornati
23 apr 2017 anni
Indicatori delle variazioni dei valori per anni
In media:
9.436
Minima:
5.622
1 gen 2002 anni
Massimo:
19.588
1 gen 2015 anni
Alla data di osservazione
Valore
Variazione assoluta
La variazione rispetto al valore precedente
1 gen 1996 anni
7.949
+7.949
0.0%
1 gen 1997 anni
5.802
-2.147
-27.01%
1 gen 1998 anni
6.366
+0.564
9.72%
1 gen 1999 anni
6.446
+0.08
1.26%
1 gen 2000 anni
7.445
+0.999
15.51%
1 gen 2001 anni
6.083
-1.362
-18.3%
1 gen 2002 anni
5.622
-0.461
-7.58%
1 gen 2003 anni
9.954
+4.332
77.06%
1 gen 2004 anni
10.835
+0.881
8.85%
1 gen 2005 anni
11.093
+0.259
2.39%
1 gen 2006 anni
9.243
-1.85
-16.68%
1 gen 2007 anni
8.616
-0.627
-6.79%
1 gen 2008 anni
7.966
-0.65
-7.54%
1 gen 2009 anni
7.94
-0.026
-0.32%
1 gen 2010 anni
8.399
+0.459
5.78%
1 gen 2011 anni
9.405
+1.006
11.98%
1 gen 2012 anni
10.416
+1.01
10.74%
1 gen 2013 anni
12.937
+2.521
24.21%
1 gen 2014 anni
16.619
+3.682
28.46%
1 gen 2015 anni
19.588
+2.969
17.86%
Classificazione dei paesi secondo i statistiche attuali per anni