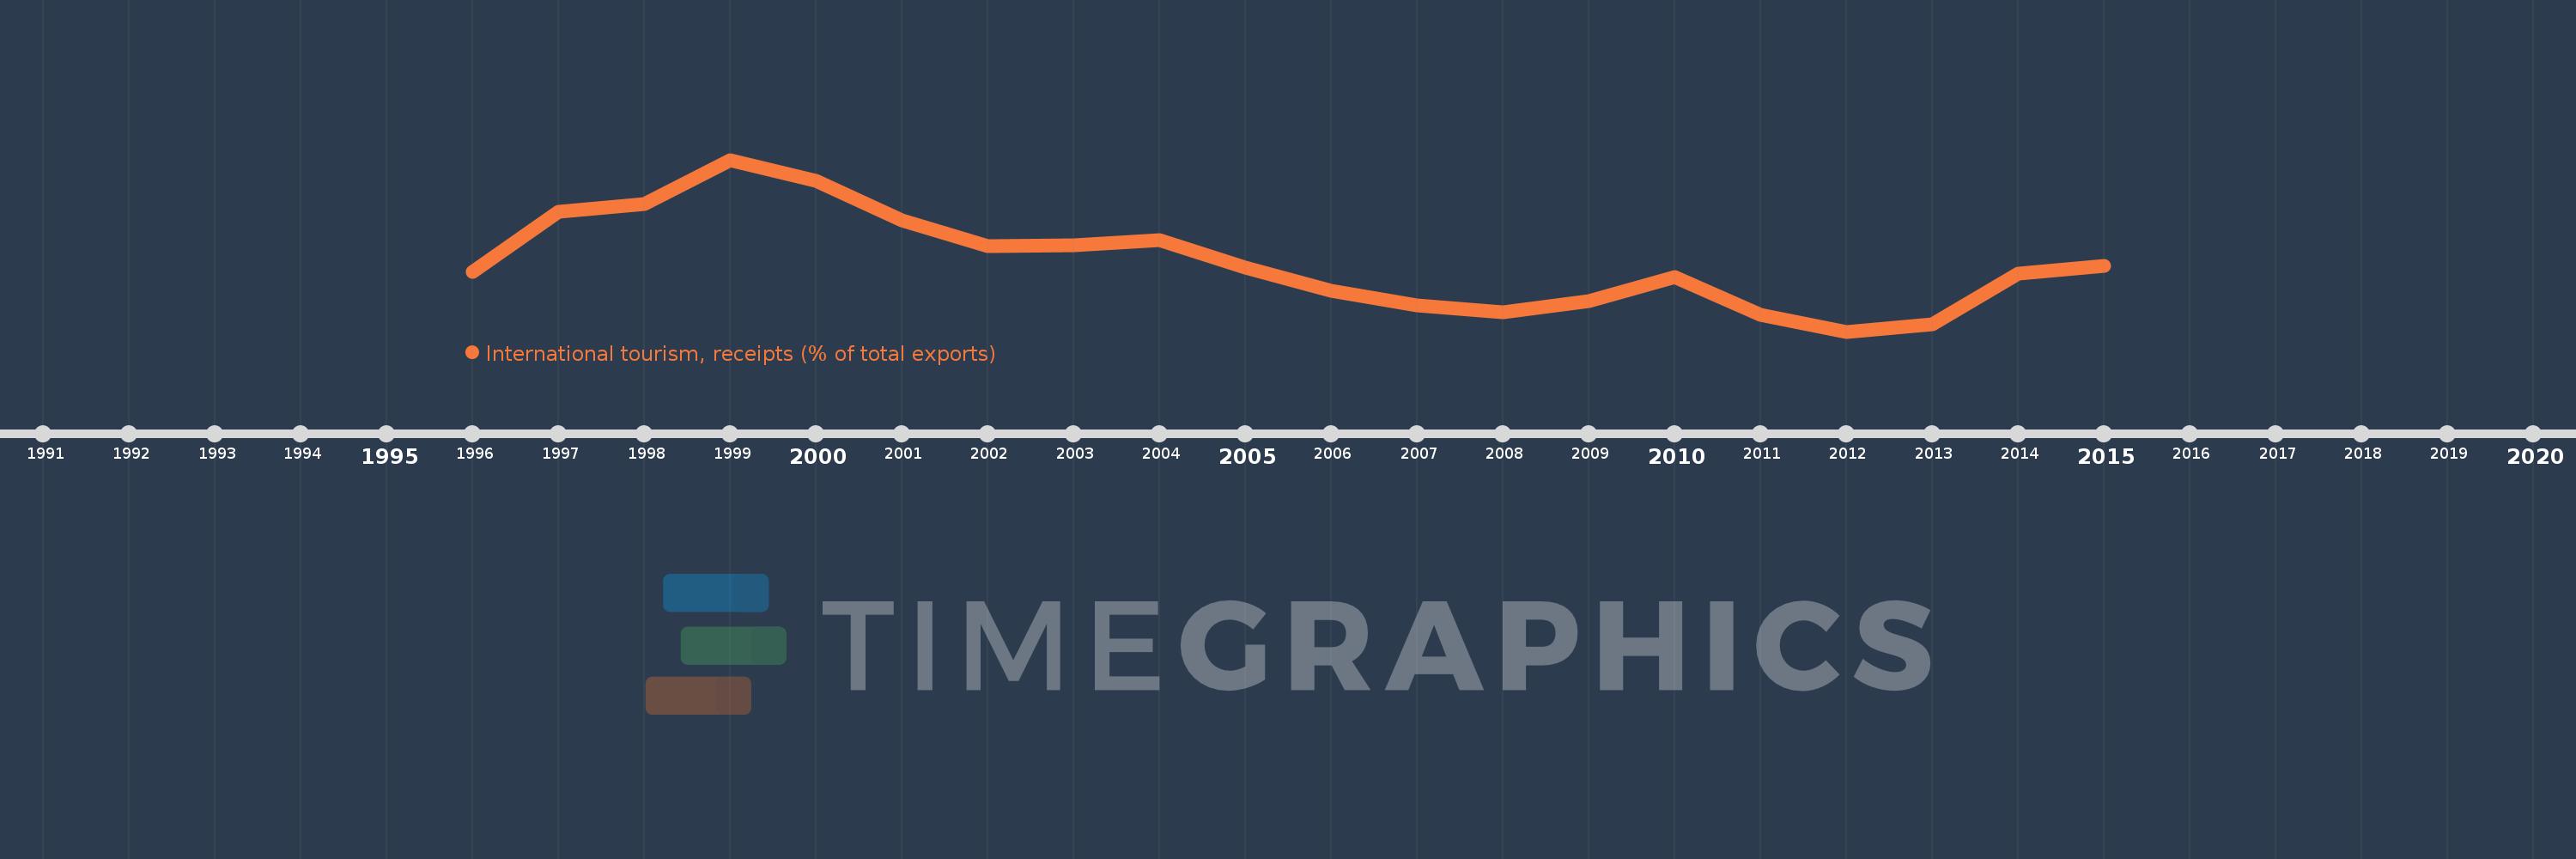
Questa scala temporale mostra un grafico dal 1996 anno al 2015 anno. Peru. I dati fino ad 1995 anno non disponibili. Il numero di osservazioni attuali secondo i date: 20.
La fonte (nome):
Indicatori dello sviluppo mondiale
La fonte (organizzazione):
World Tourism Organization, Yearbook of Tourism Statistics, Compendium of Tourism Statistics and data files, and IMF and World Bank exports estimates.
Categorie:
Private Sector, Trade
sono stati aggiornati
23 apr 2017 anni
Indicatori delle variazioni dei valori per anni
In media:
8.666
Minima:
5.635
1 gen 2012 anni
Massimo:
13.132
1 gen 1999 anni
Alla data di osservazione
Valore
Variazione assoluta
La variazione rispetto al valore precedente
1 gen 1996 anni
8.24
+8.24
0.0%
1 gen 1997 anni
10.857
+2.618
31.77%
1 gen 1998 anni
11.213
+0.356
3.28%
1 gen 1999 anni
13.132
+1.919
17.11%
1 gen 2000 anni
12.218
-0.914
-6.96%
1 gen 2001 anni
10.494
-1.724
-14.11%
1 gen 2002 anni
9.354
-1.139
-10.86%
1 gen 2003 anni
9.389
+0.035
0.37%
1 gen 2004 anni
9.634
+0.245
2.61%
1 gen 2005 anni
8.445
-1.189
-12.34%
1 gen 2006 anni
7.419
-1.025
-12.14%
1 gen 2007 anni
6.794
-0.625
-8.43%
1 gen 2008 anni
6.49
-0.304
-4.48%
1 gen 2009 anni
6.984
+0.494
7.61%
1 gen 2010 anni
8.026
+1.042
14.92%
1 gen 2011 anni
6.373
-1.654
-20.6%
1 gen 2012 anni
5.635
-0.738
-11.58%
1 gen 2013 anni
5.958
+0.324
5.75%
1 gen 2014 anni
8.173
+2.214
37.16%
1 gen 2015 anni
8.484
+0.311
3.81%
Classificazione dei paesi secondo i statistiche attuali per anni