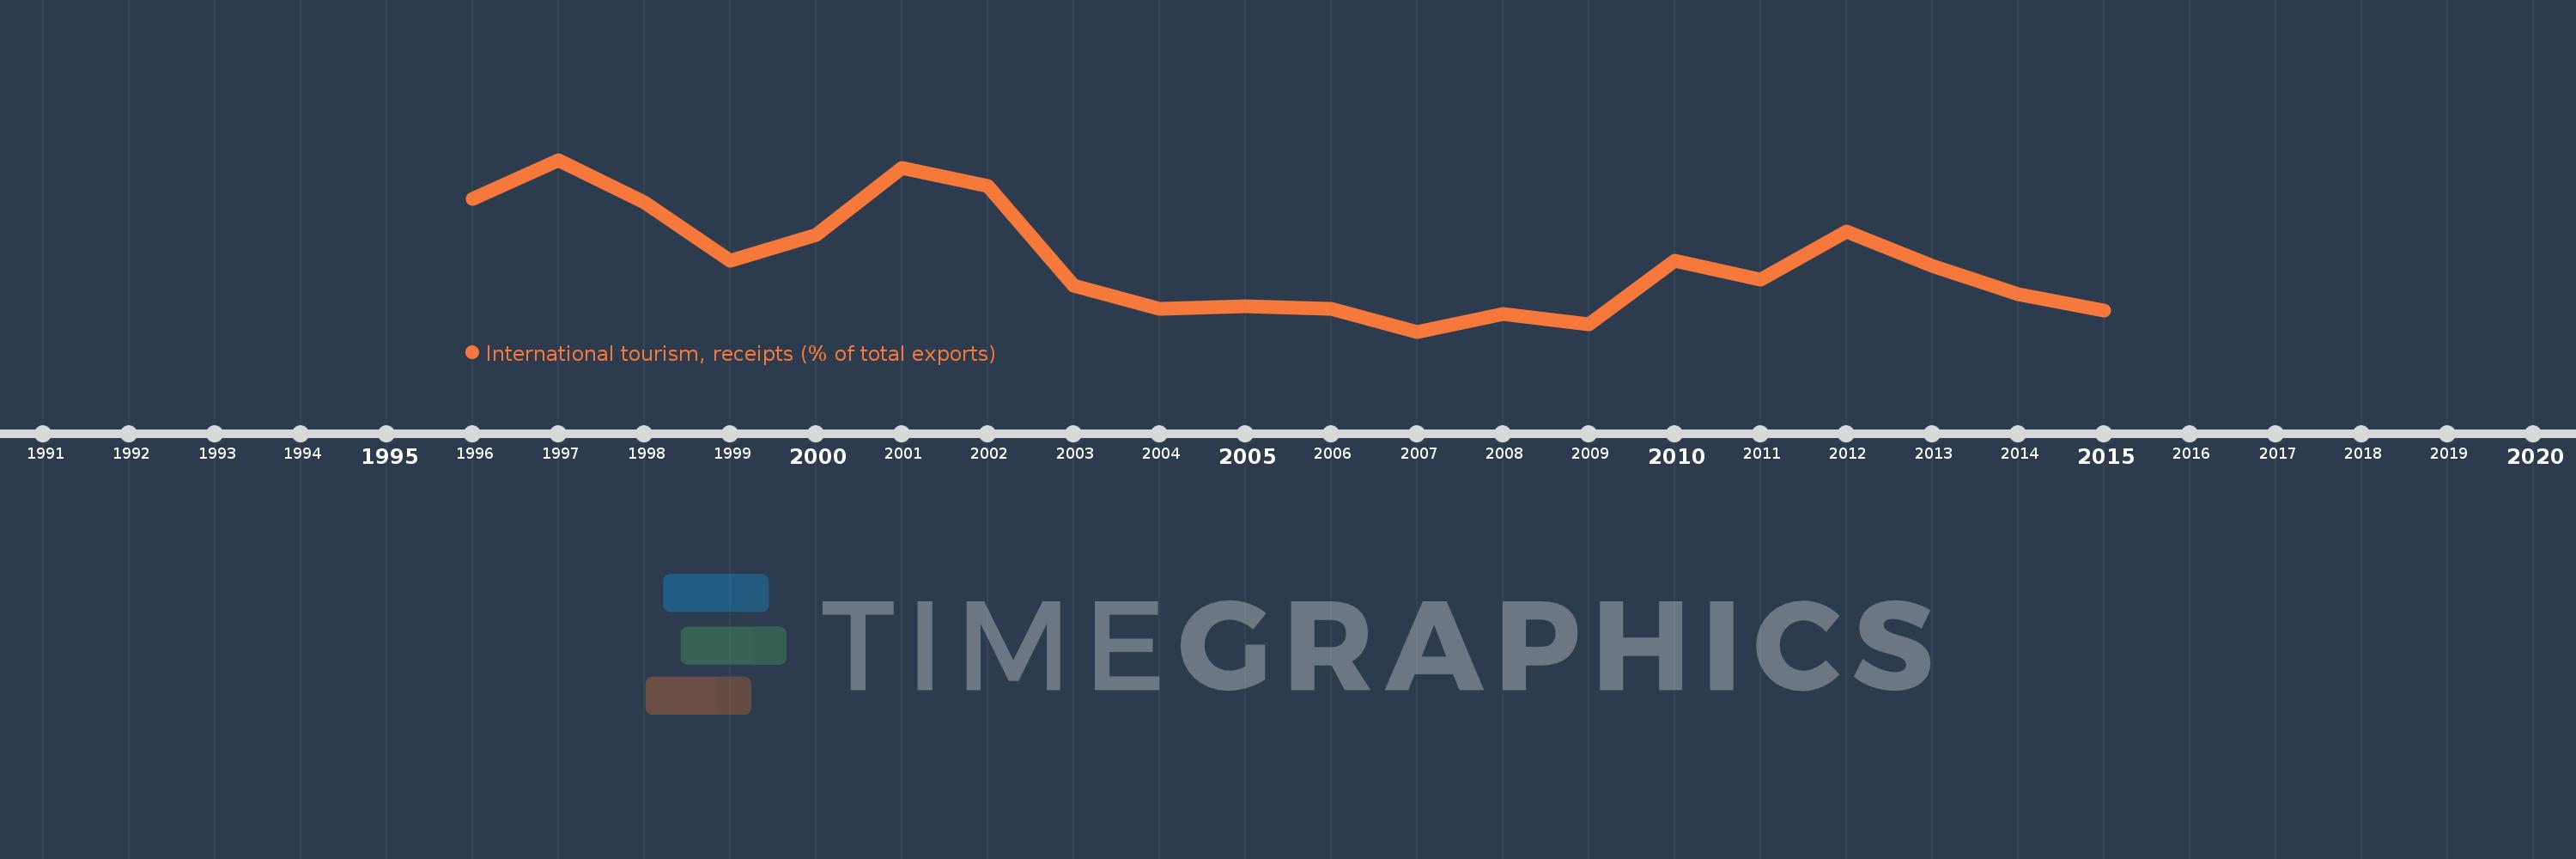
Questa scala temporale mostra un grafico dal 1996 anno al 2015 anno. Uruguay. I dati fino ad 1995 anno non disponibili. Il numero di osservazioni attuali secondo i date: 20.
La fonte (nome):
Indicatori dello sviluppo mondiale
La fonte (organizzazione):
World Tourism Organization, Yearbook of Tourism Statistics, Compendium of Tourism Statistics and data files, and IMF and World Bank exports estimates.
Categorie:
Private Sector, Trade
sono stati aggiornati
23 apr 2017 anni
Indicatori delle variazioni dei valori per anni
In media:
16.7
Minima:
12.286
1 gen 2007 anni
Massimo:
23.134
1 gen 1997 anni
Alla data di osservazione
Valore
Variazione assoluta
La variazione rispetto al valore precedente
1 gen 1996 anni
20.674
+20.674
0.0%
1 gen 1997 anni
23.134
+2.46
11.9%
1 gen 1998 anni
20.44
-2.694
-11.64%
1 gen 1999 anni
16.753
-3.687
-18.04%
1 gen 2000 anni
18.383
+1.63
9.73%
1 gen 2001 anni
22.598
+4.215
22.93%
1 gen 2002 anni
21.459
-1.139
-5.04%
1 gen 2003 anni
15.185
-6.274
-29.24%
1 gen 2004 anni
13.726
-1.459
-9.61%
1 gen 2005 anni
13.884
+0.158
1.15%
1 gen 2006 anni
13.745
-0.139
-1.0%
1 gen 2007 anni
12.286
-1.46
-10.62%
1 gen 2008 anni
13.385
+1.099
8.94%
1 gen 2009 anni
12.75
-0.634
-4.74%
1 gen 2010 anni
16.759
+4.009
31.44%
1 gen 2011 anni
15.571
-1.189
-7.09%
1 gen 2012 anni
18.59
+3.019
19.39%
1 gen 2013 anni
16.417
-2.173
-11.69%
1 gen 2014 anni
14.667
-1.75
-10.66%
1 gen 2015 anni
13.596
-1.071
-7.3%
Classificazione dei paesi secondo i statistiche attuali per anni