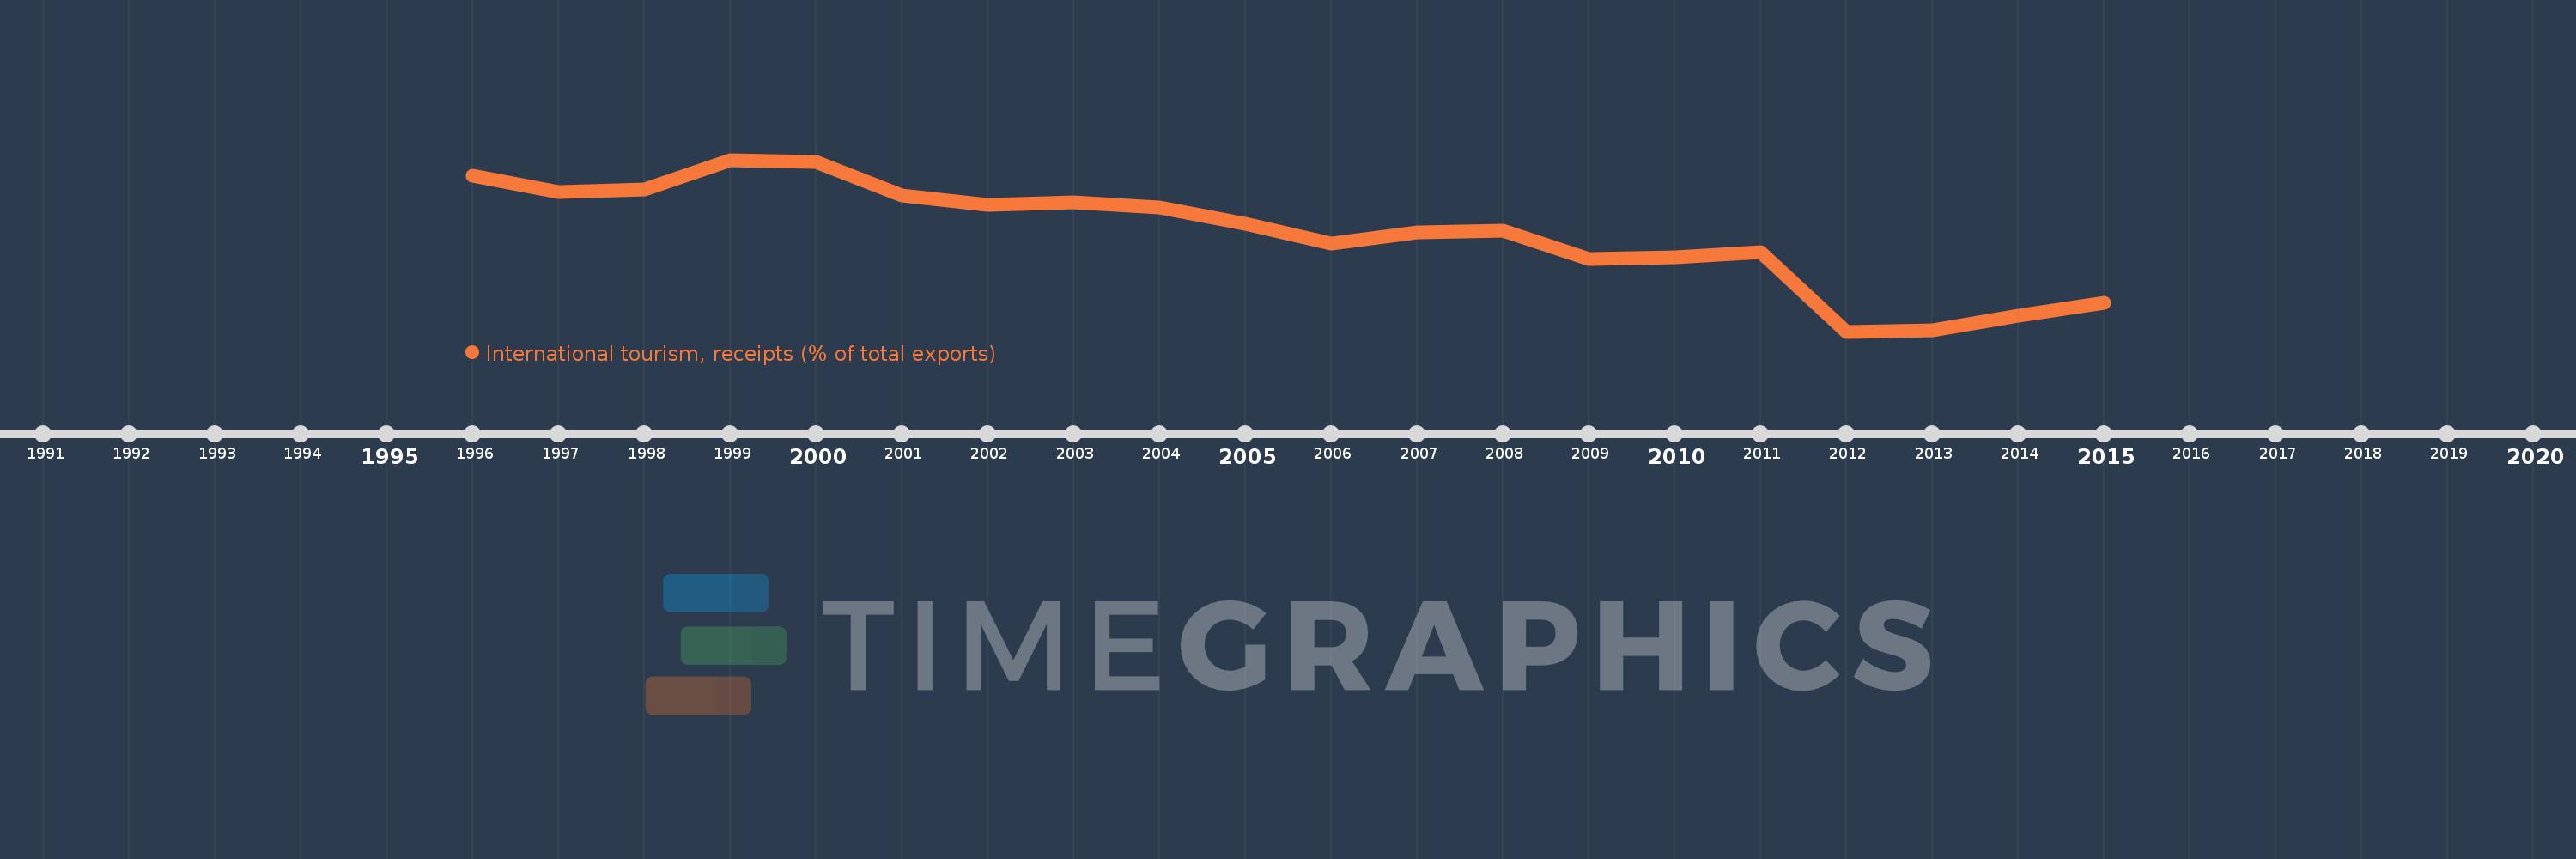
Questa scala temporale mostra un grafico dal 1996 anno al 2015 anno. Other small states. I dati fino ad 1995 anno non disponibili. Il numero di osservazioni attuali secondo i date: 20.
La fonte (nome):
Indicatori dello sviluppo mondiale
La fonte (organizzazione):
World Tourism Organization, Yearbook of Tourism Statistics, Compendium of Tourism Statistics and data files, and IMF and World Bank exports estimates.
Categorie:
Private Sector, Trade
sono stati aggiornati
23 apr 2017 anni
Indicatori delle variazioni dei valori per anni
In media:
16.249
Minima:
8.144
1 gen 2012 anni
Massimo:
22.33
1 gen 1999 anni
Alla data di osservazione
Valore
Variazione assoluta
La variazione rispetto al valore precedente
1 gen 1996 anni
21.021
+21.021
0.0%
1 gen 1997 anni
19.696
-1.325
-6.3%
1 gen 1998 anni
19.879
+0.183
0.93%
1 gen 1999 anni
22.33
+2.452
12.33%
1 gen 2000 anni
22.144
-0.187
-0.84%
1 gen 2001 anni
19.353
-2.791
-12.6%
1 gen 2002 anni
18.626
-0.726
-3.75%
1 gen 2003 anni
18.826
+0.2
1.07%
1 gen 2004 anni
18.42
-0.406
-2.15%
1 gen 2005 anni
17.03
-1.39
-7.55%
1 gen 2006 anni
15.419
-1.612
-9.46%
1 gen 2007 anni
16.326
+0.908
5.89%
1 gen 2008 anni
16.457
+0.131
0.8%
1 gen 2009 anni
14.105
-2.353
-14.3%
1 gen 2010 anni
14.307
+0.202
1.43%
1 gen 2011 anni
14.705
+0.398
2.78%
1 gen 2012 anni
8.144
-6.561
-44.62%
1 gen 2013 anni
8.221
+0.078
0.95%
1 gen 2014 anni
9.442
+1.22
14.85%
1 gen 2015 anni
10.523
+1.081
11.45%
Classificazione dei paesi secondo i statistiche attuali per anni