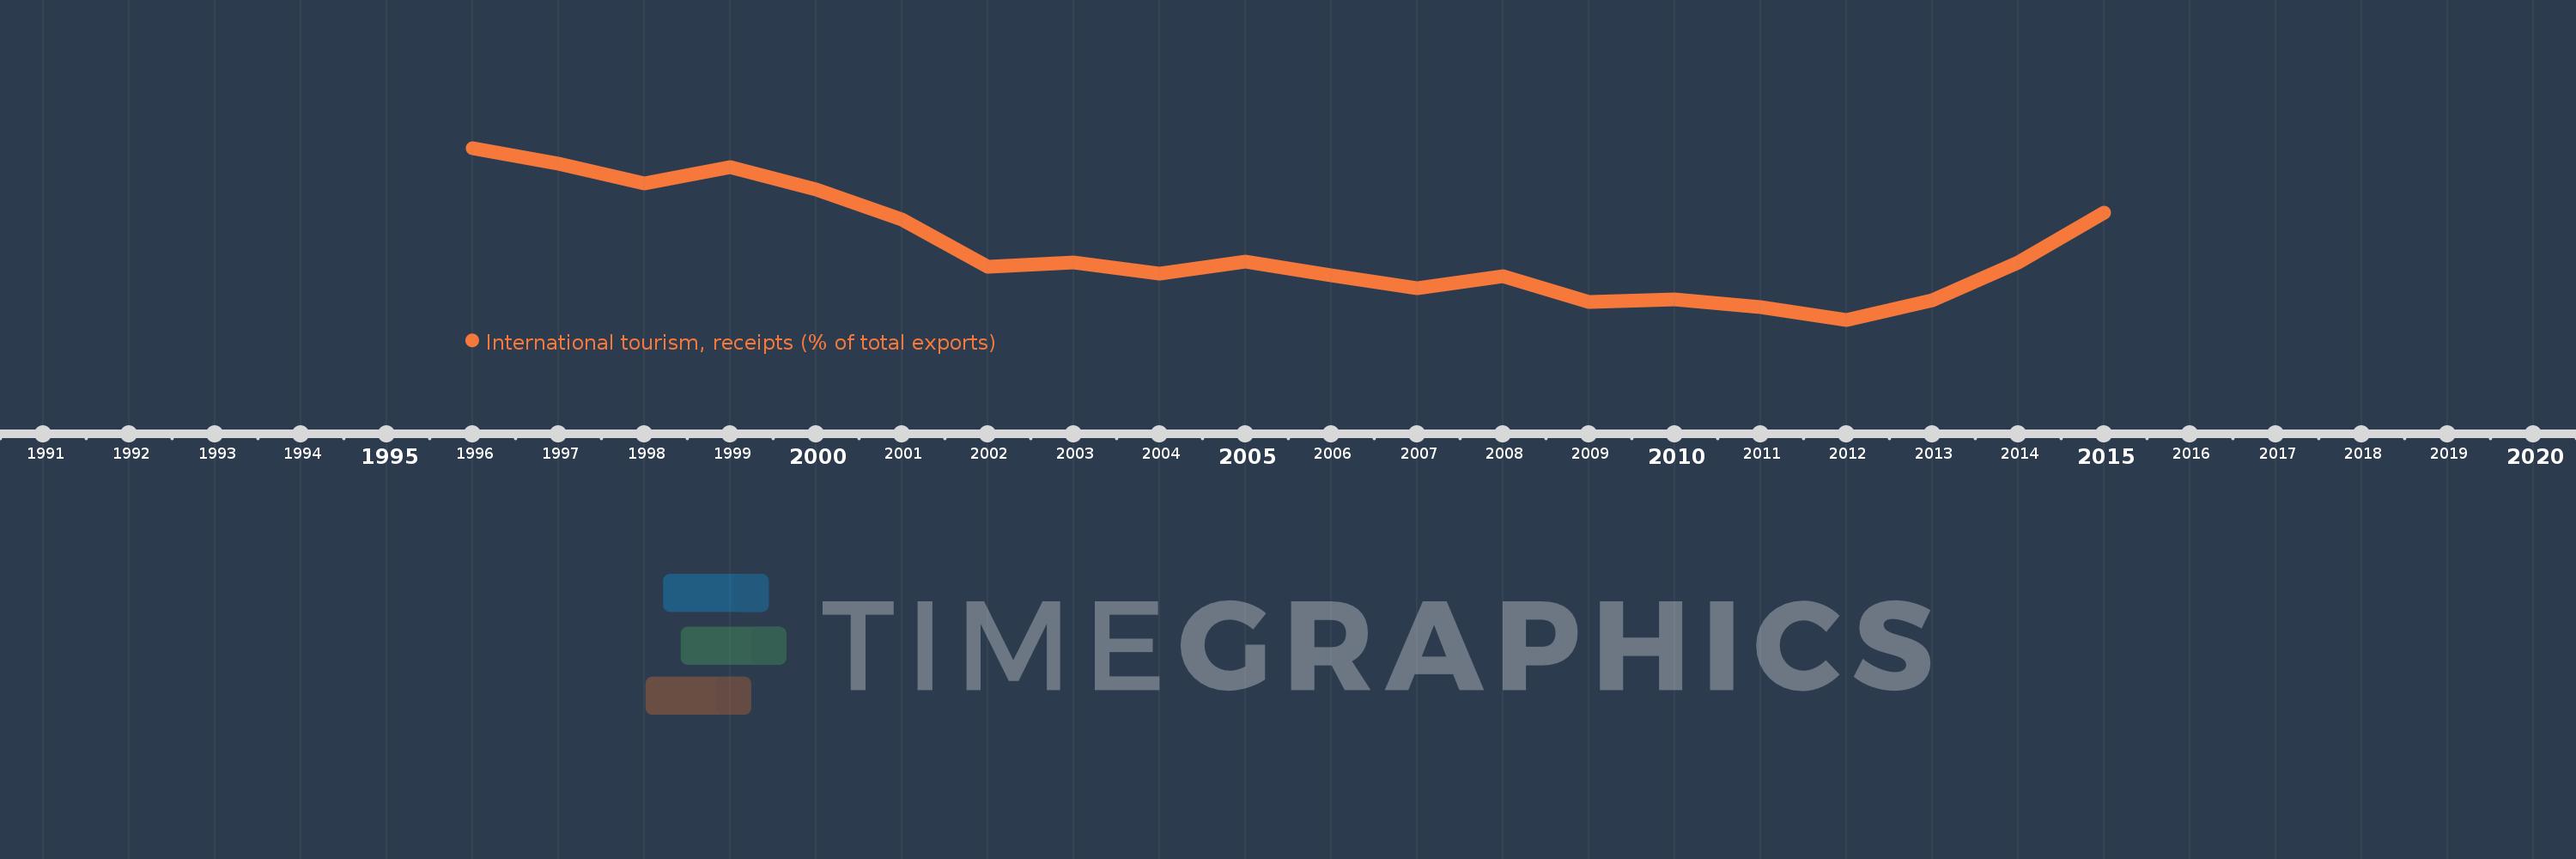
Questa scala temporale mostra un grafico dal 1996 anno al 2015 anno. United Kingdom. I dati fino ad 1995 anno non disponibili. Il numero di osservazioni attuali secondo i date: 20.
La fonte (nome):
Indicatori dello sviluppo mondiale
La fonte (organizzazione):
World Tourism Organization, Yearbook of Tourism Statistics, Compendium of Tourism Statistics and data files, and IMF and World Bank exports estimates.
Categorie:
Private Sector, Trade
sono stati aggiornati
23 apr 2017 anni
Indicatori delle variazioni dei valori per anni
In media:
6.841
Minima:
5.633
1 gen 2012 anni
Massimo:
8.561
1 gen 1996 anni
Alla data di osservazione
Valore
Variazione assoluta
La variazione rispetto al valore precedente
1 gen 1996 anni
8.561
+8.561
0.0%
1 gen 1997 anni
8.294
-0.267
-3.12%
1 gen 1998 anni
7.955
-0.339
-4.08%
1 gen 1999 anni
8.237
+0.282
3.55%
1 gen 2000 anni
7.852
-0.385
-4.68%
1 gen 2001 anni
7.344
-0.508
-6.47%
1 gen 2002 anni
6.529
-0.815
-11.1%
1 gen 2003 anni
6.615
+0.087
1.33%
1 gen 2004 anni
6.415
-0.2
-3.02%
1 gen 2005 anni
6.624
+0.209
3.26%
1 gen 2006 anni
6.394
-0.23
-3.47%
1 gen 2007 anni
6.176
-0.218
-3.41%
1 gen 2008 anni
6.37
+0.194
3.15%
1 gen 2009 anni
5.939
-0.431
-6.77%
1 gen 2010 anni
5.985
+0.046
0.77%
1 gen 2011 anni
5.854
-0.131
-2.19%
1 gen 2012 anni
5.633
-0.221
-3.77%
1 gen 2013 anni
5.968
+0.335
5.94%
1 gen 2014 anni
6.612
+0.645
10.81%
1 gen 2015 anni
7.461
+0.848
12.83%
Classificazione dei paesi secondo i statistiche attuali per anni