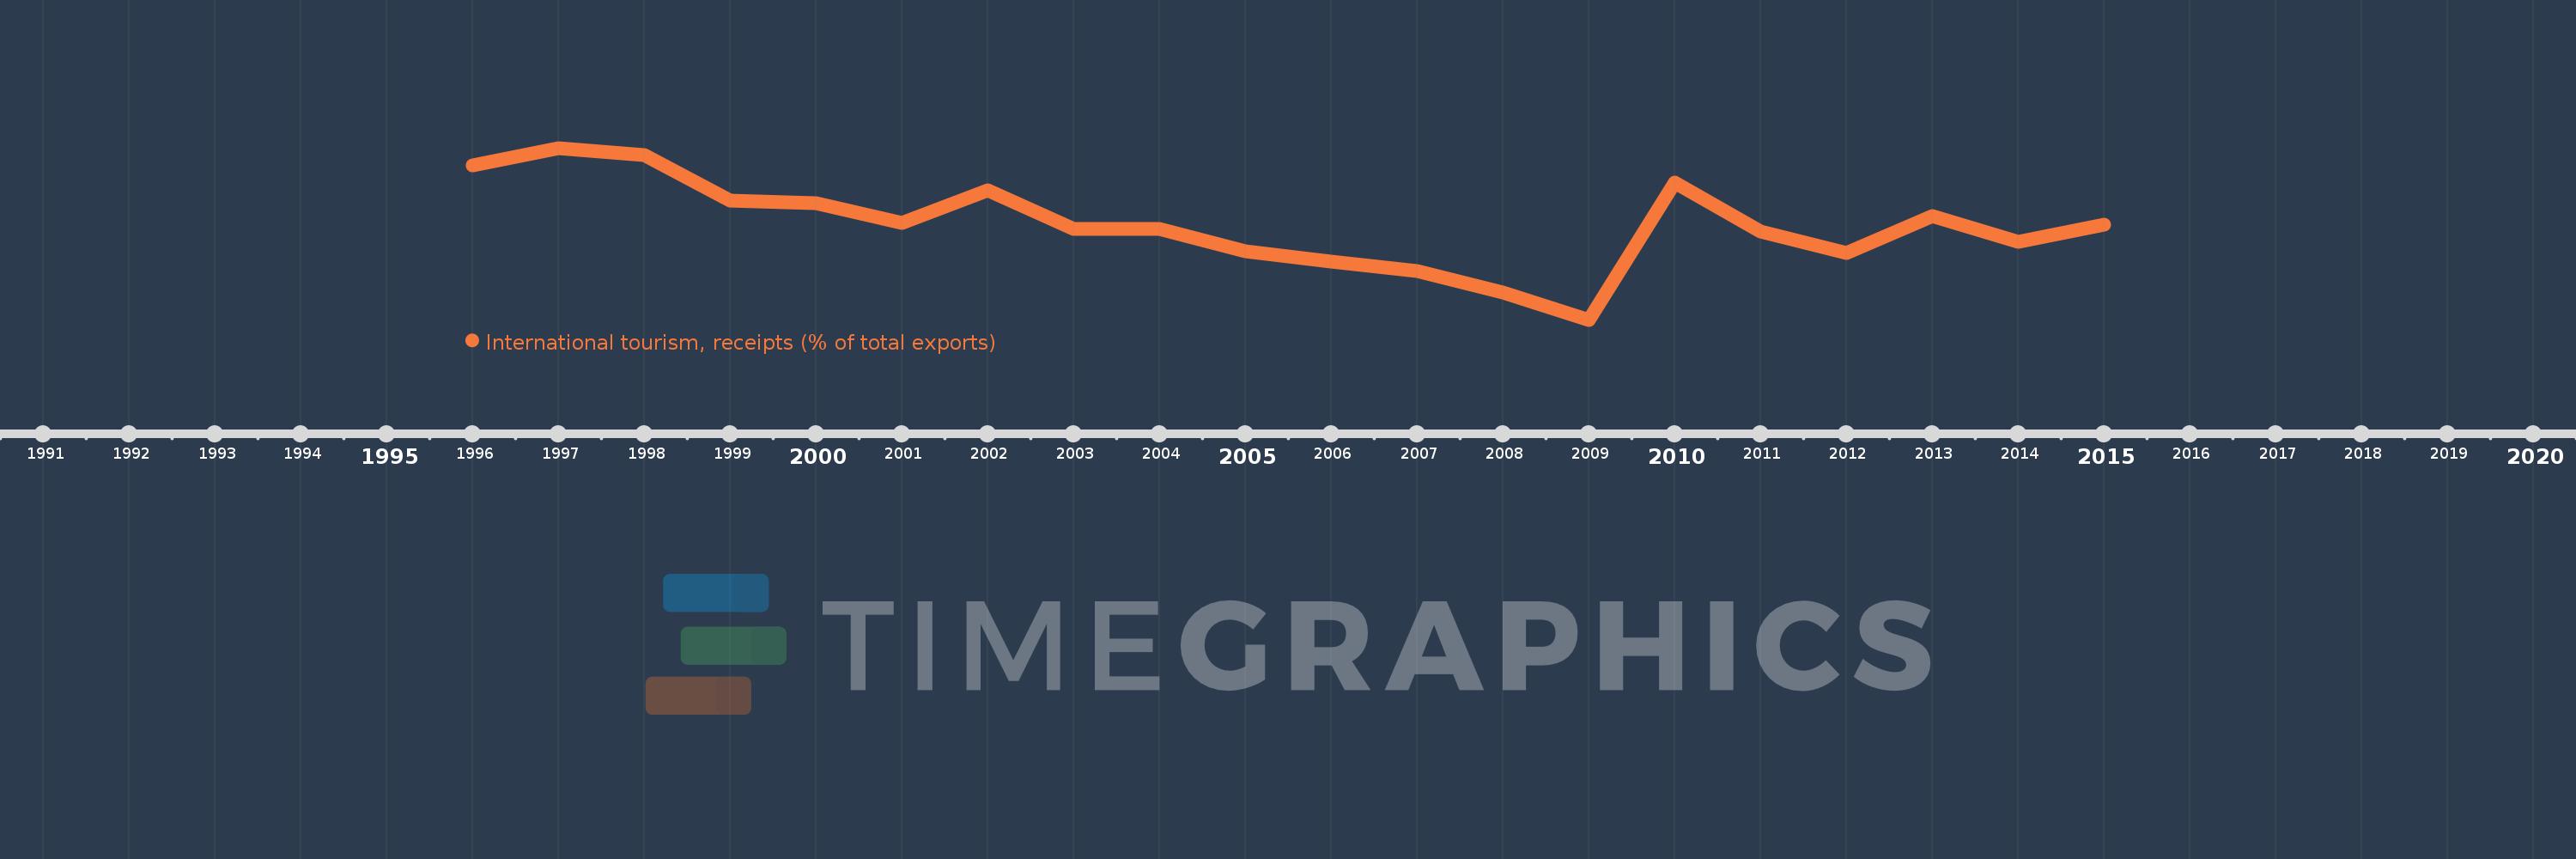
Questa scala temporale mostra un grafico dal 1996 anno al 2015 anno. Paraguay. I dati fino ad 1995 anno non disponibili. Il numero di osservazioni attuali secondo i date: 20.
La fonte (nome):
Indicatori dello sviluppo mondiale
La fonte (organizzazione):
World Tourism Organization, Yearbook of Tourism Statistics, Compendium of Tourism Statistics and data files, and IMF and World Bank exports estimates.
Categorie:
Private Sector, Trade
sono stati aggiornati
23 apr 2017 anni
Indicatori delle variazioni dei valori per anni
In media:
2.266
Minima:
1.263
1 gen 2009 anni
Massimo:
3.071
1 gen 1997 anni
Alla data di osservazione
Valore
Variazione assoluta
La variazione rispetto al valore precedente
1 gen 1996 anni
2.887
+2.887
0.0%
1 gen 1997 anni
3.071
+0.184
6.39%
1 gen 1998 anni
2.992
-0.079
-2.57%
1 gen 1999 anni
2.513
-0.48
-16.03%
1 gen 2000 anni
2.49
-0.023
-0.91%
1 gen 2001 anni
2.286
-0.204
-8.19%
1 gen 2002 anni
2.627
+0.341
14.92%
1 gen 2003 anni
2.215
-0.412
-15.69%
1 gen 2004 anni
2.22
+0.006
0.25%
1 gen 2005 anni
1.979
-0.241
-10.87%
1 gen 2006 anni
1.879
-0.1
-5.04%
1 gen 2007 anni
1.778
-0.101
-5.37%
1 gen 2008 anni
1.551
-0.227
-12.77%
1 gen 2009 anni
1.263
-0.288
-18.59%
1 gen 2010 anni
2.708
+1.446
114.51%
1 gen 2011 anni
2.191
-0.517
-19.09%
1 gen 2012 anni
1.962
-0.229
-10.45%
1 gen 2013 anni
2.358
+0.395
20.15%
1 gen 2014 anni
2.08
-0.277
-11.77%
1 gen 2015 anni
2.266
+0.185
8.91%
Classificazione dei paesi secondo i statistiche attuali per anni