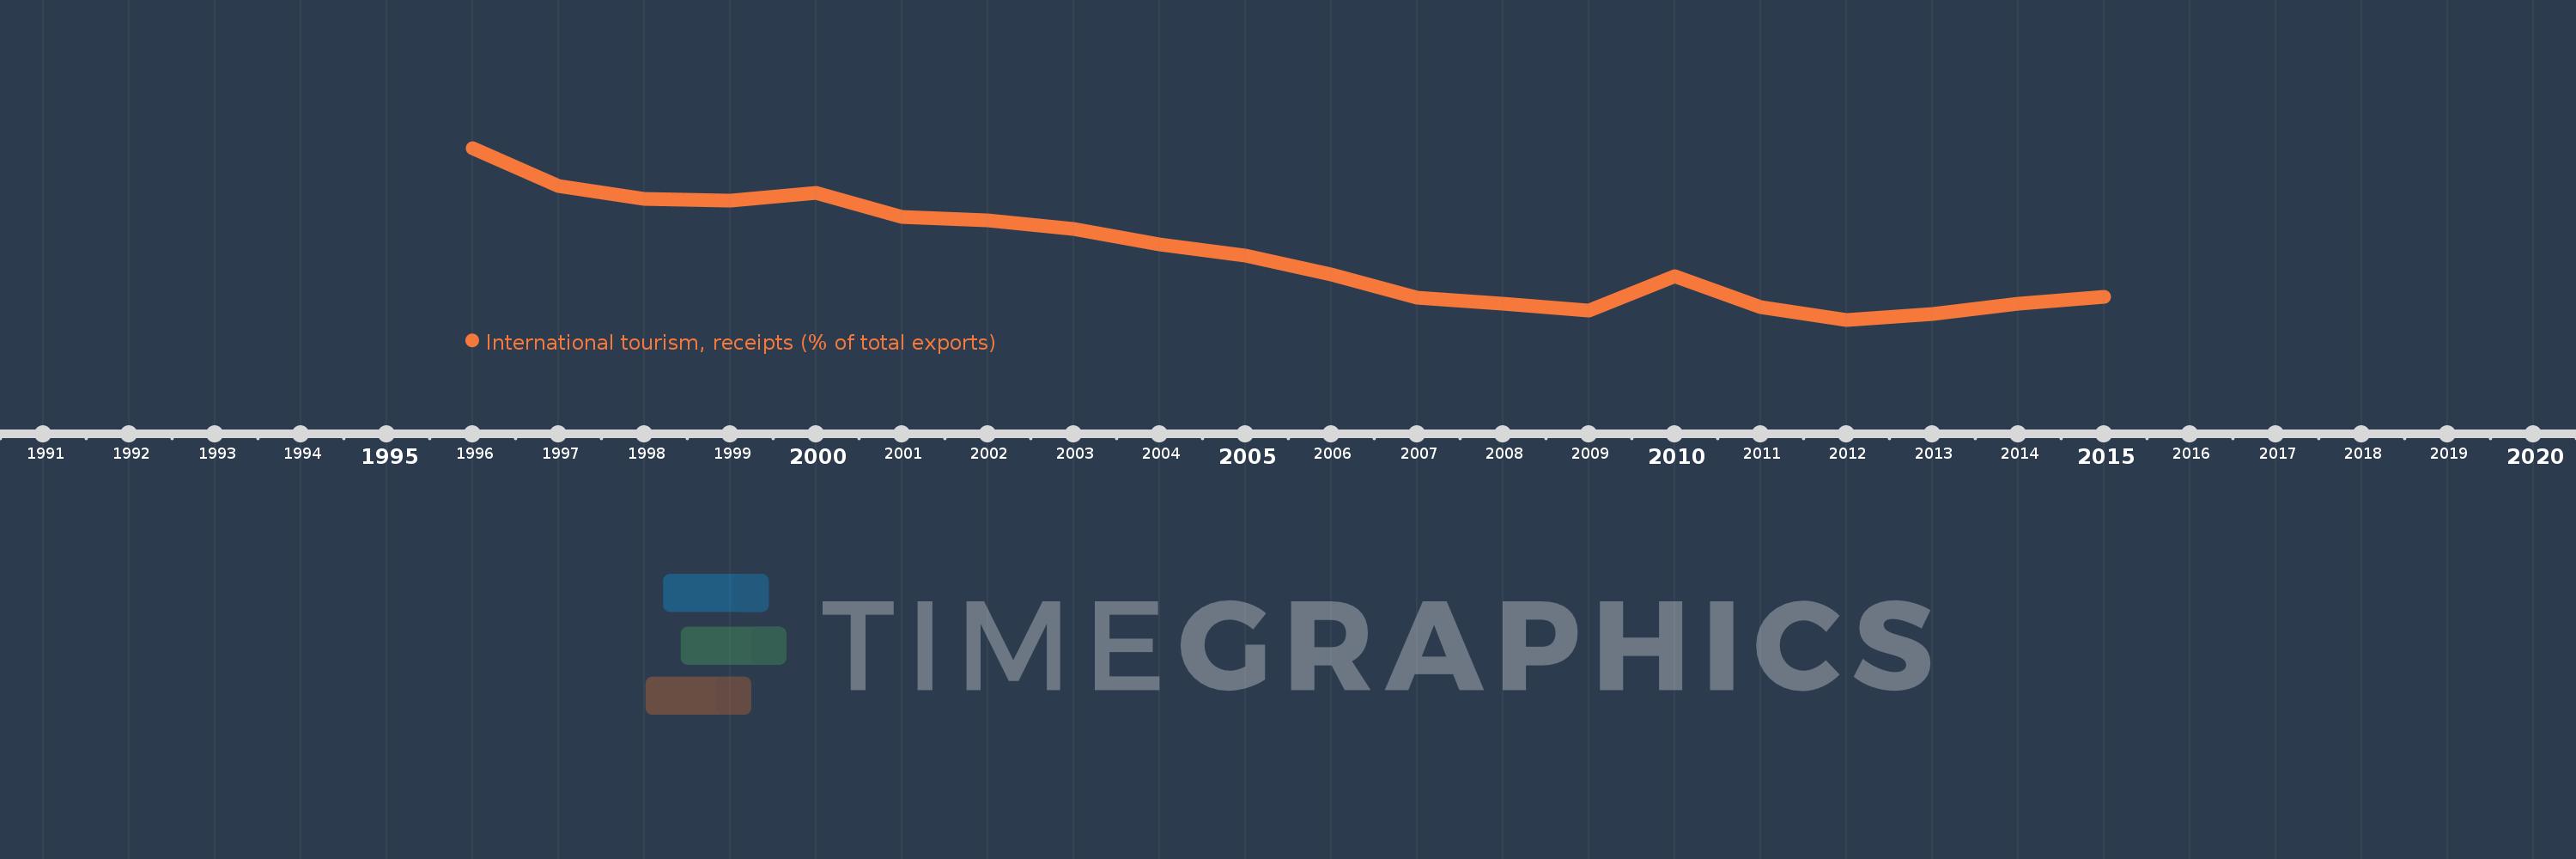
Questa scala temporale mostra un grafico dal 1996 anno al 2015 anno. OECD members. I dati fino ad 1995 anno non disponibili. Il numero di osservazioni attuali secondo i date: 20.
La fonte (nome):
Indicatori dello sviluppo mondiale
La fonte (organizzazione):
World Tourism Organization, Yearbook of Tourism Statistics, Compendium of Tourism Statistics and data files, and IMF and World Bank exports estimates.
Categorie:
Private Sector, Trade
sono stati aggiornati
23 apr 2017 anni
Indicatori delle variazioni dei valori per anni
In media:
6.923
Minima:
5.747
1 gen 2012 anni
Massimo:
8.857
1 gen 1996 anni
Alla data di osservazione
Valore
Variazione assoluta
La variazione rispetto al valore precedente
1 gen 1996 anni
8.857
+8.857
0.0%
1 gen 1997 anni
8.172
-0.686
-7.74%
1 gen 1998 anni
7.942
-0.23
-2.81%
1 gen 1999 anni
7.909
-0.033
-0.41%
1 gen 2000 anni
8.037
+0.127
1.61%
1 gen 2001 anni
7.615
-0.422
-5.25%
1 gen 2002 anni
7.547
-0.068
-0.89%
1 gen 2003 anni
7.384
-0.163
-2.16%
1 gen 2004 anni
7.116
-0.268
-3.62%
1 gen 2005 anni
6.908
-0.209
-2.93%
1 gen 2006 anni
6.574
-0.334
-4.83%
1 gen 2007 anni
6.143
-0.431
-6.55%
1 gen 2008 anni
6.038
-0.105
-1.71%
1 gen 2009 anni
5.92
-0.118
-1.96%
1 gen 2010 anni
6.528
+0.608
10.26%
1 gen 2011 anni
5.974
-0.553
-8.48%
1 gen 2012 anni
5.747
-0.227
-3.8%
1 gen 2013 anni
5.853
+0.106
1.84%
1 gen 2014 anni
6.04
+0.187
3.2%
1 gen 2015 anni
6.163
+0.123
2.04%
Classificazione dei paesi secondo i statistiche attuali per anni