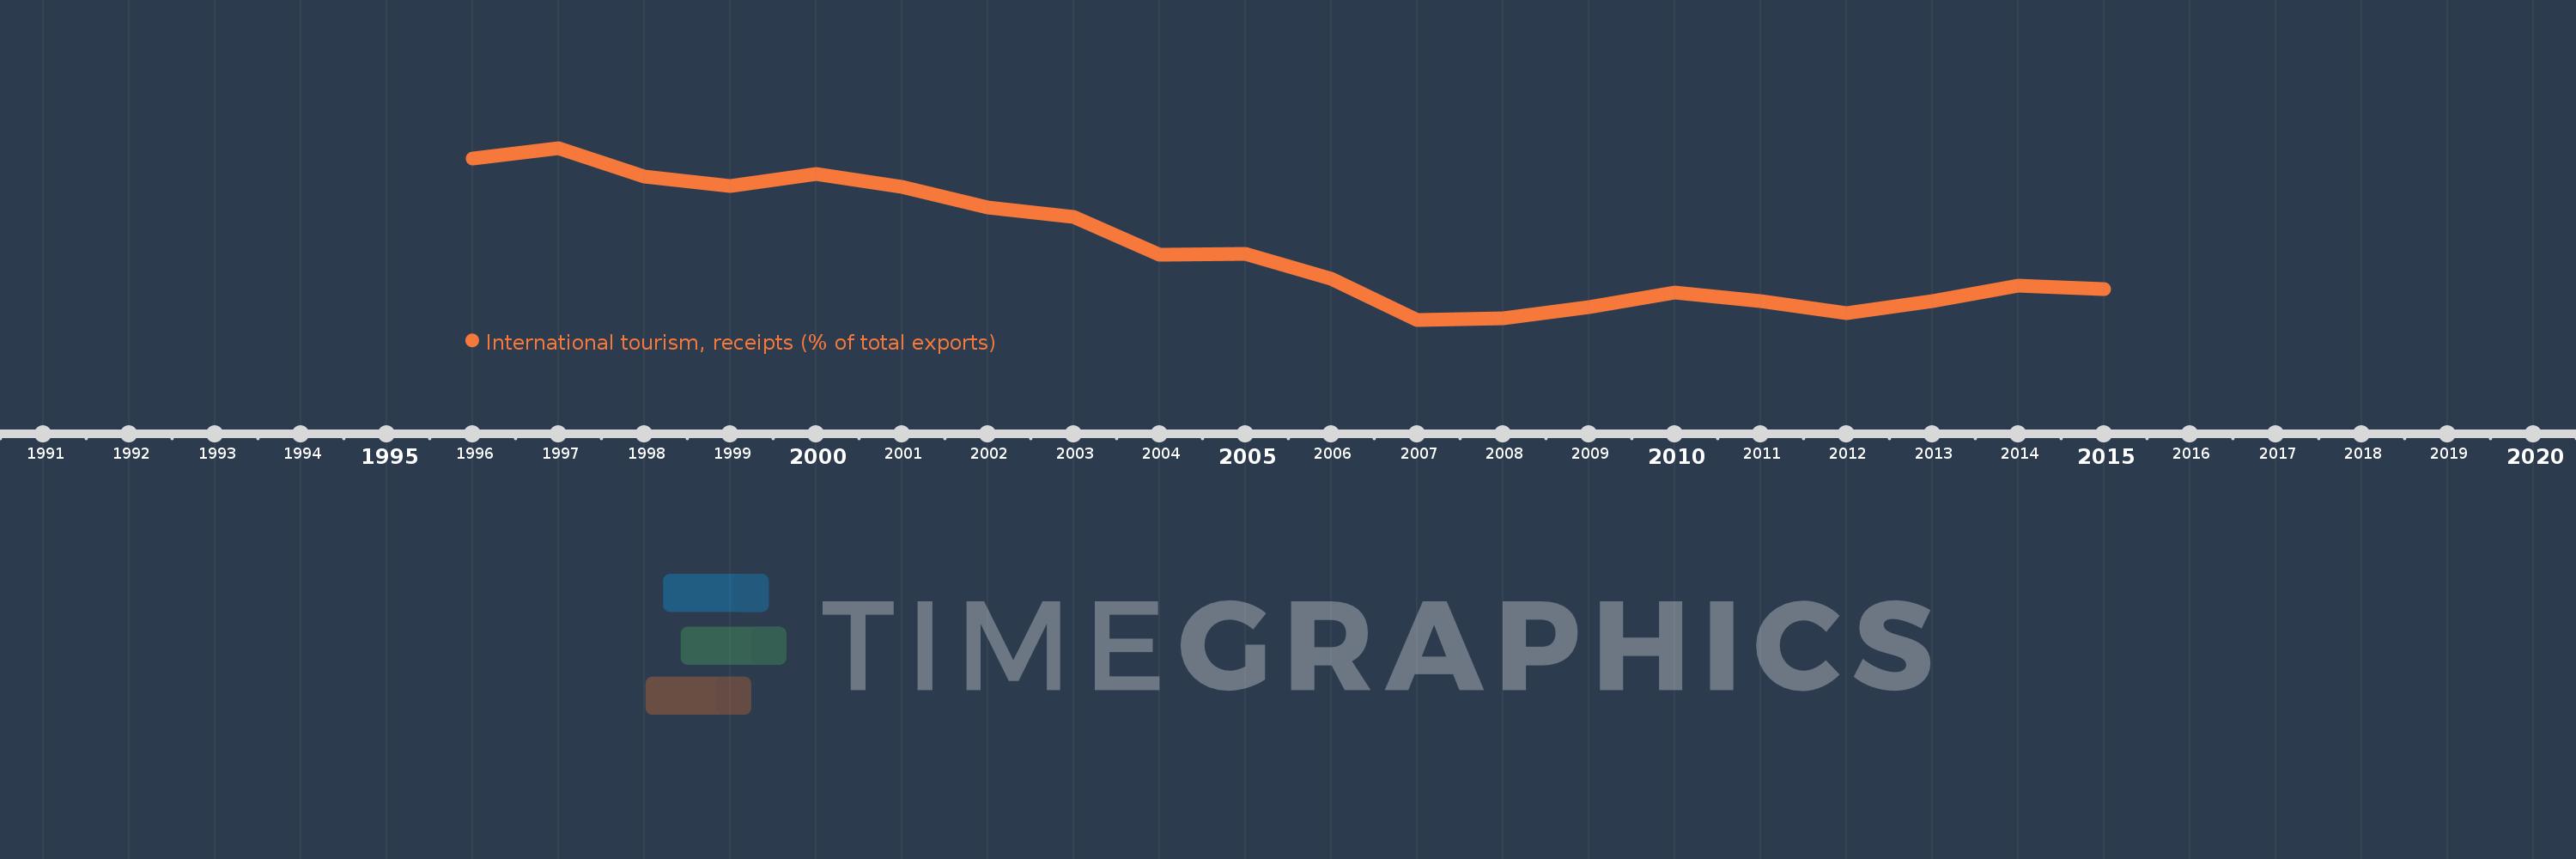
Questa scala temporale mostra un grafico dal 1996 anno al 2015 anno. United States. I dati fino ad 1995 anno non disponibili. Il numero di osservazioni attuali secondo i date: 20.
La fonte (nome):
Indicatori dello sviluppo mondiale
La fonte (organizzazione):
World Tourism Organization, Yearbook of Tourism Statistics, Compendium of Tourism Statistics and data files, and IMF and World Bank exports estimates.
Categorie:
Private Sector, Trade
sono stati aggiornati
23 apr 2017 anni
Indicatori delle variazioni dei valori per anni
In media:
10.068
Minima:
8.697
1 gen 2007 anni
Massimo:
12.0
1 gen 1997 anni
Alla data di osservazione
Valore
Variazione assoluta
La variazione rispetto al valore precedente
1 gen 1996 anni
11.801
+11.801
0.0%
1 gen 1997 anni
12.0
+0.2
1.69%
1 gen 1998 anni
11.456
-0.545
-4.54%
1 gen 1999 anni
11.262
-0.194
-1.69%
1 gen 2000 anni
11.494
+0.232
2.06%
1 gen 2001 anni
11.244
-0.25
-2.17%
1 gen 2002 anni
10.849
-0.395
-3.52%
1 gen 2003 anni
10.67
-0.179
-1.65%
1 gen 2004 anni
9.95
-0.72
-6.74%
1 gen 2005 anni
9.96
+0.01
0.1%
1 gen 2006 anni
9.493
-0.467
-4.69%
1 gen 2007 anni
8.697
-0.795
-8.38%
1 gen 2008 anni
8.722
+0.025
0.28%
1 gen 2009 anni
8.944
+0.222
2.55%
1 gen 2010 anni
9.223
+0.278
3.11%
1 gen 2011 anni
9.063
-0.16
-1.73%
1 gen 2012 anni
8.821
-0.242
-2.67%
1 gen 2013 anni
9.058
+0.237
2.68%
1 gen 2014 anni
9.355
+0.296
3.27%
1 gen 2015 anni
9.289
-0.066
-0.7%
Classificazione dei paesi secondo i statistiche attuali per anni