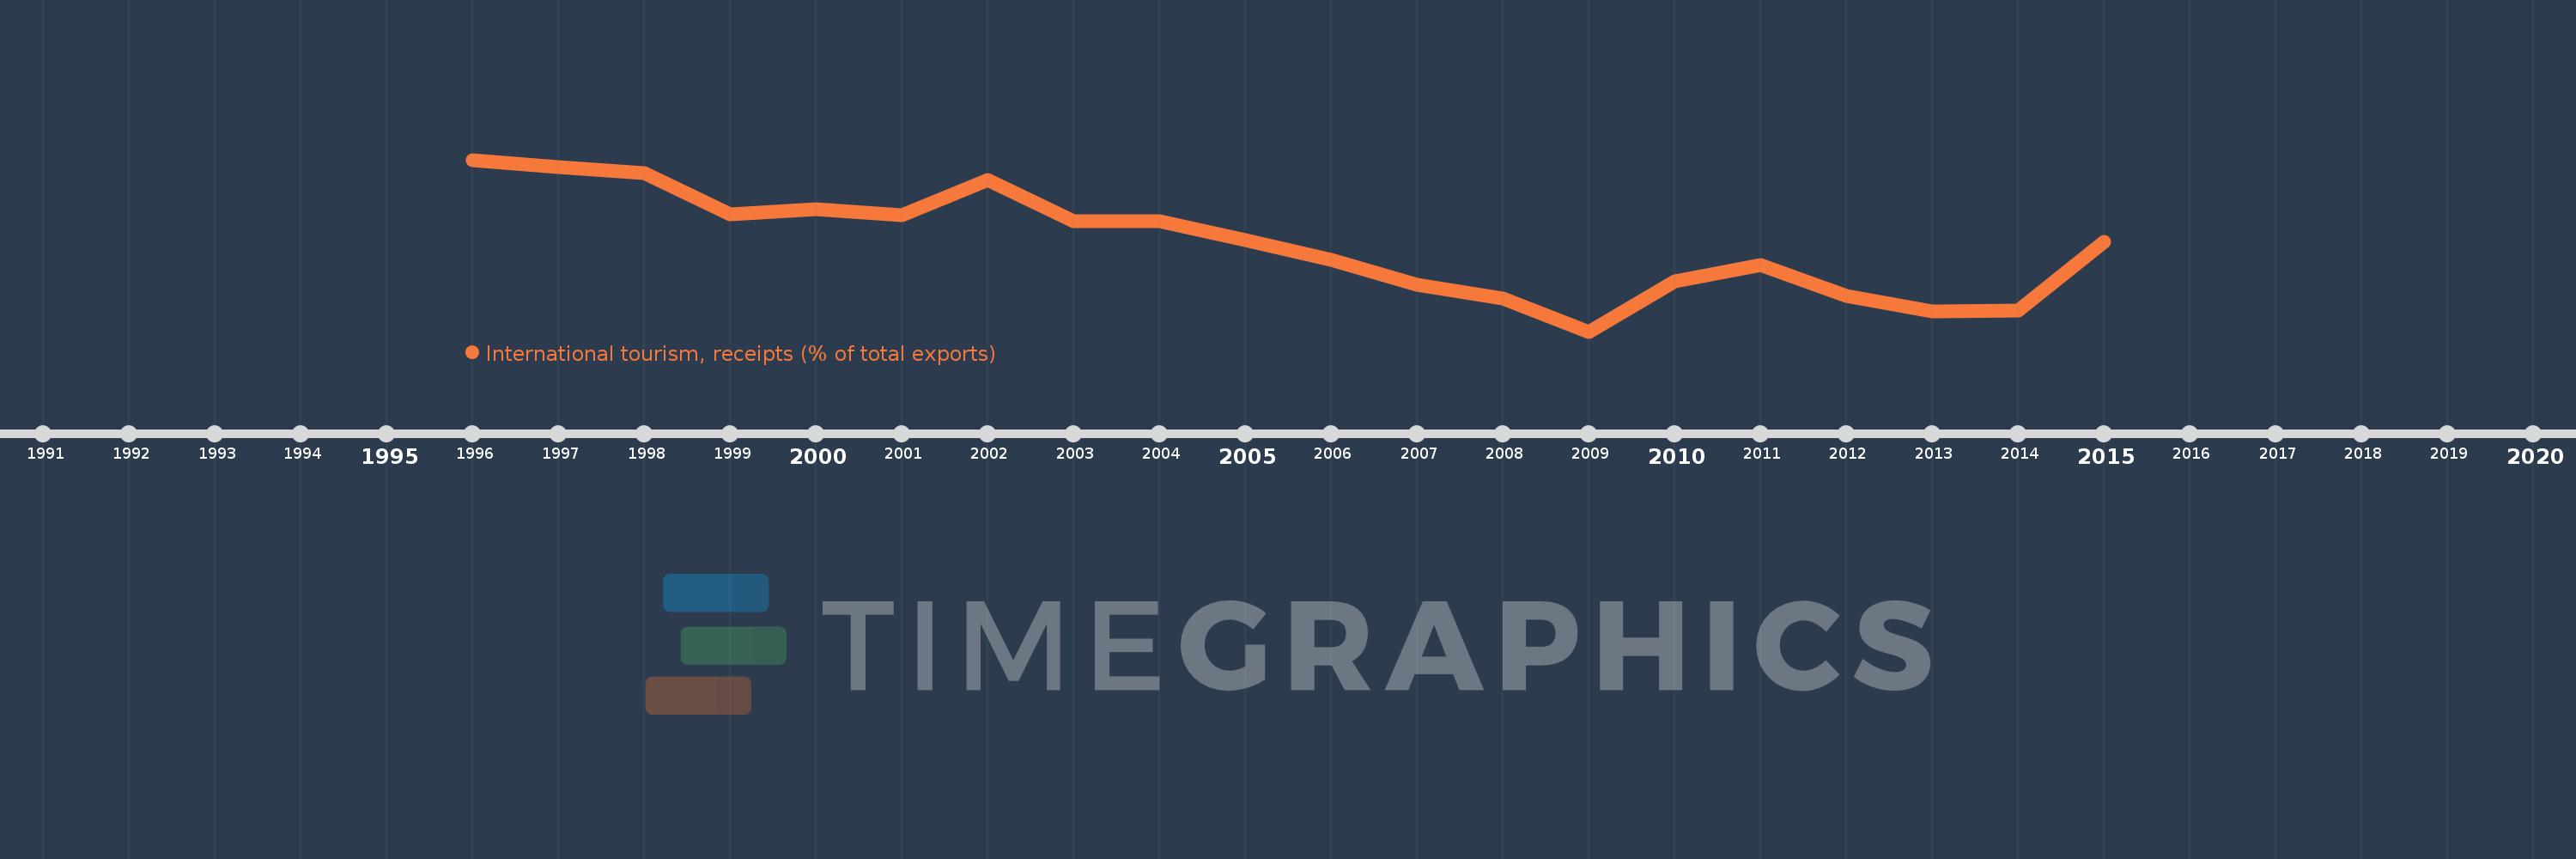
Questa scala temporale mostra un grafico dal 1996 anno al 2015 anno. Bahamas, The. I dati fino ad 1995 anno non disponibili. Il numero di osservazioni attuali secondo i date: 20.
La fonte (nome):
Indicatori dello sviluppo mondiale
La fonte (organizzazione):
World Tourism Organization, Yearbook of Tourism Statistics, Compendium of Tourism Statistics and data files, and IMF and World Bank exports estimates.
Categorie:
Private Sector, Trade
sono stati aggiornati
23 apr 2017 anni
Indicatori delle variazioni dei valori per anni
In media:
69.37
Minima:
61.752
1 gen 2009 anni
Massimo:
76.71
1 gen 1996 anni
Alla data di osservazione
Valore
Variazione assoluta
La variazione rispetto al valore precedente
1 gen 1996 anni
76.71
+76.71
0.0%
1 gen 1997 anni
76.1
-0.609
-0.79%
1 gen 1998 anni
75.587
-0.514
-0.68%
1 gen 1999 anni
71.997
-3.589
-4.75%
1 gen 2000 anni
72.393
+0.395
0.55%
1 gen 2001 anni
71.903
-0.49
-0.68%
1 gen 2002 anni
74.956
+3.053
4.25%
1 gen 2003 anni
71.381
-3.575
-4.77%
1 gen 2004 anni
71.337
-0.044
-0.06%
1 gen 2005 anni
69.703
-1.634
-2.29%
1 gen 2006 anni
68.006
-1.697
-2.44%
1 gen 2007 anni
65.804
-2.202
-3.24%
1 gen 2008 anni
64.624
-1.18
-1.79%
1 gen 2009 anni
61.752
-2.872
-4.44%
1 gen 2010 anni
66.143
+4.391
7.11%
1 gen 2011 anni
67.553
+1.41
2.13%
1 gen 2012 anni
64.83
-2.723
-4.03%
1 gen 2013 anni
63.476
-1.354
-2.09%
1 gen 2014 anni
63.566
+0.09
0.14%
1 gen 2015 anni
69.571
+6.005
9.45%
Classificazione dei paesi secondo i statistiche attuali per anni