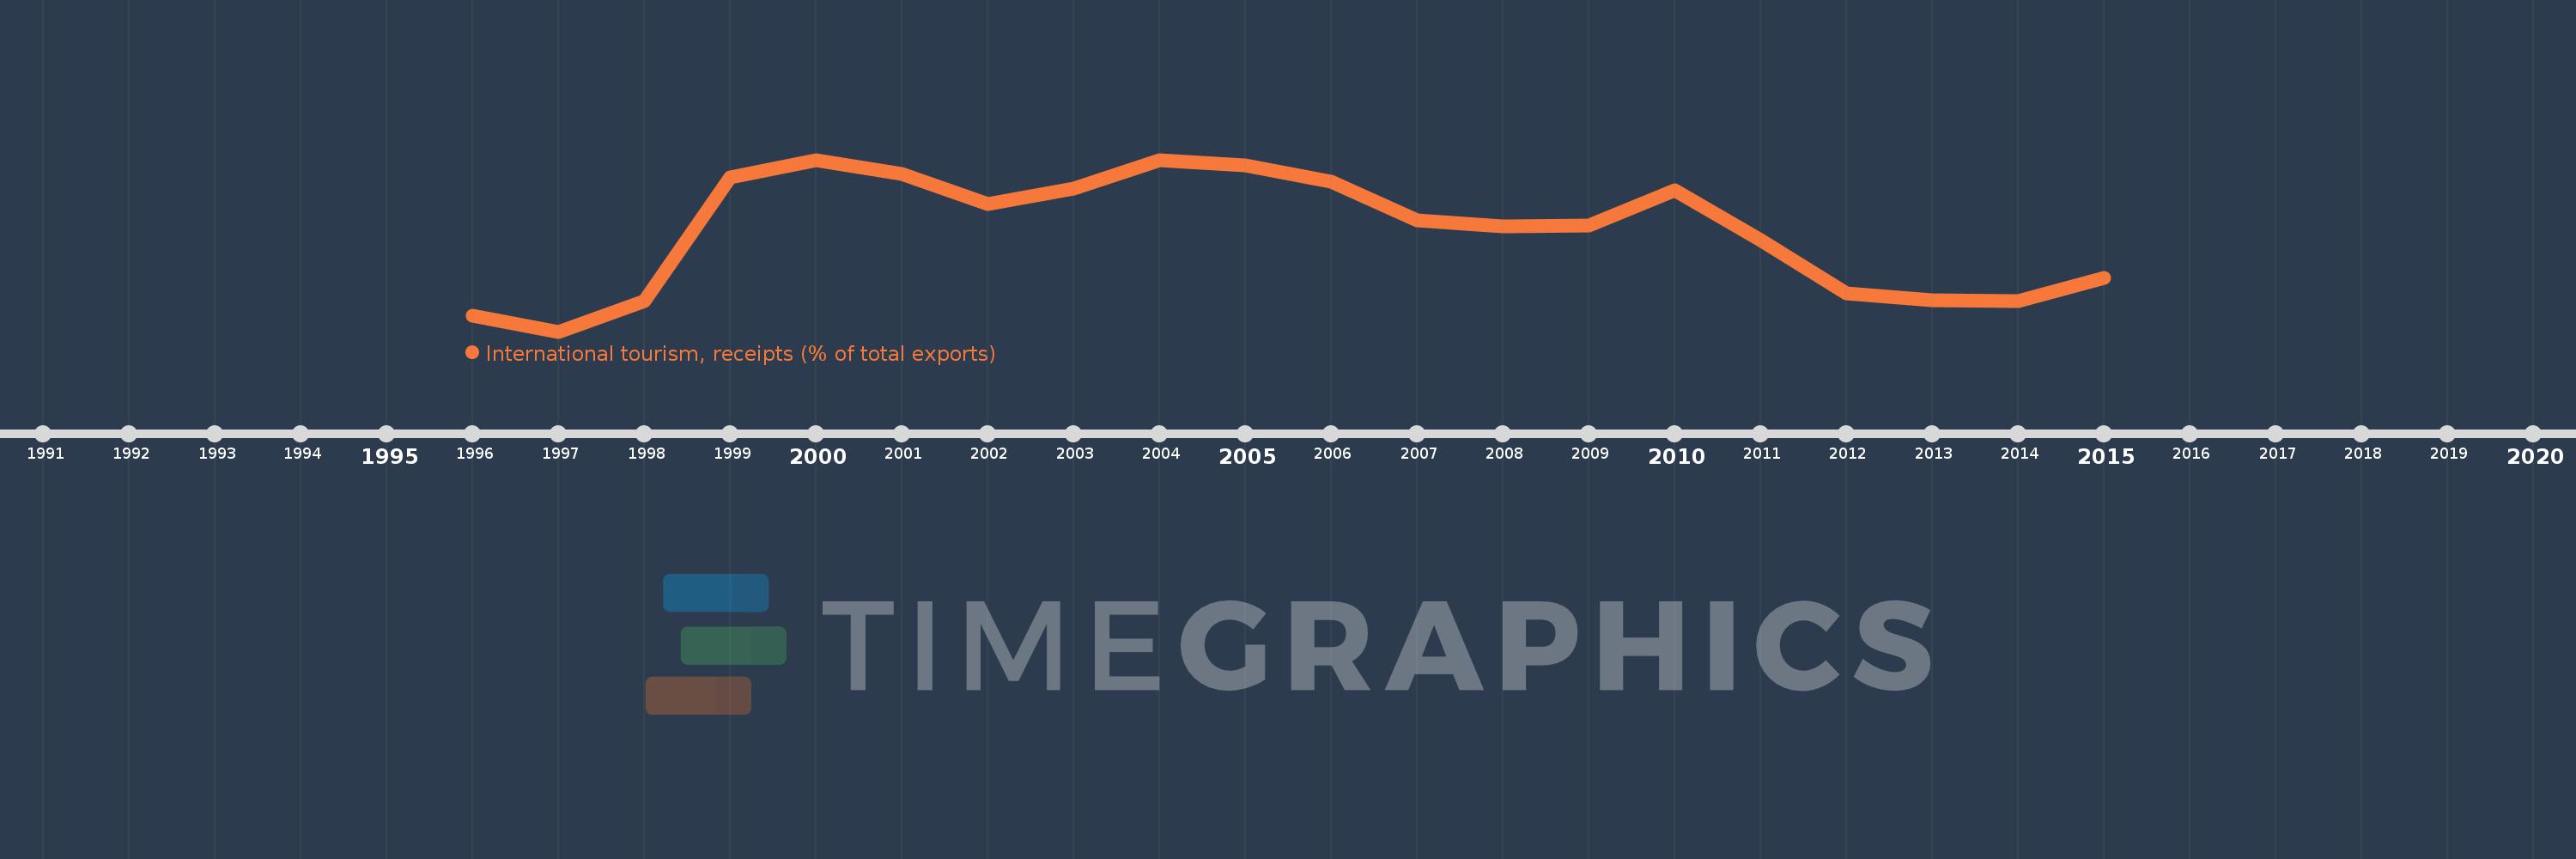
Questa scala temporale mostra un grafico dal 1996 anno al 2015 anno. Bulgaria. I dati fino ad 1995 anno non disponibili. Il numero di osservazioni attuali secondo i date: 20.
La fonte (nome):
Indicatori dello sviluppo mondiale
La fonte (organizzazione):
World Tourism Organization, Yearbook of Tourism Statistics, Compendium of Tourism Statistics and data files, and IMF and World Bank exports estimates.
Categorie:
Private Sector, Trade
sono stati aggiornati
23 apr 2017 anni
Indicatori delle variazioni dei valori per anni
In media:
15.51
Minima:
8.647
1 gen 1997 anni
Massimo:
20.46
1 gen 2004 anni
Alla data di osservazione
Valore
Variazione assoluta
La variazione rispetto al valore precedente
1 gen 1996 anni
9.769
+9.769
0.0%
1 gen 1997 anni
8.647
-1.122
-11.48%
1 gen 1998 anni
10.728
+2.08
24.06%
1 gen 1999 anni
19.227
+8.499
79.22%
1 gen 2000 anni
20.432
+1.206
6.27%
1 gen 2001 anni
19.486
-0.946
-4.63%
1 gen 2002 anni
17.412
-2.074
-10.64%
1 gen 2003 anni
18.456
+1.043
5.99%
1 gen 2004 anni
20.46
+2.004
10.86%
1 gen 2005 anni
20.055
-0.405
-1.98%
1 gen 2006 anni
18.956
-1.099
-5.48%
1 gen 2007 anni
16.267
-2.689
-14.19%
1 gen 2008 anni
15.899
-0.369
-2.27%
1 gen 2009 anni
15.936
+0.038
0.24%
1 gen 2010 anni
18.367
+2.43
15.25%
1 gen 2011 anni
14.911
-3.456
-18.82%
1 gen 2012 anni
11.272
-3.639
-24.4%
1 gen 2013 anni
10.786
-0.487
-4.32%
1 gen 2014 anni
10.767
-0.018
-0.17%
1 gen 2015 anni
12.366
+1.599
14.85%
Classificazione dei paesi secondo i statistiche attuali per anni