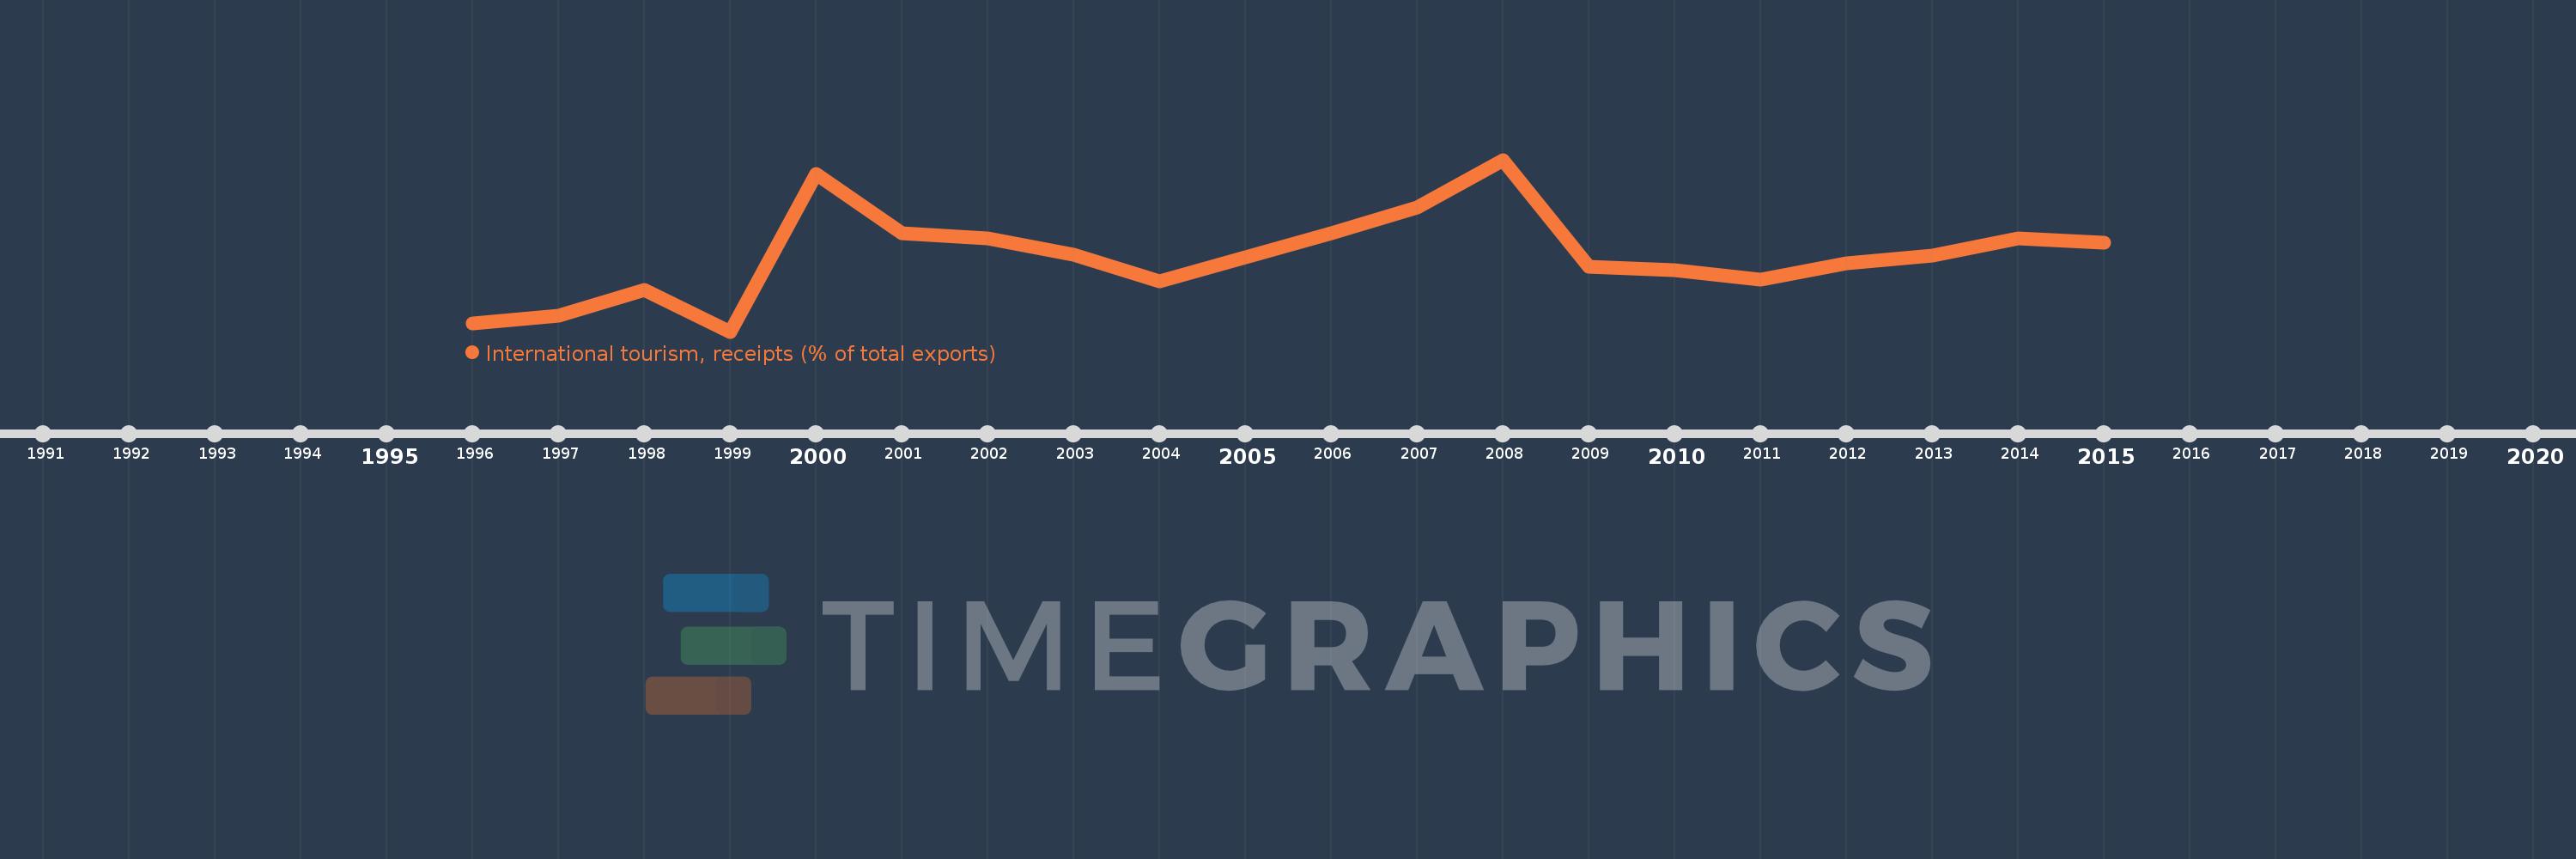
Questa scala temporale mostra un grafico dal 1996 anno al 2015 anno. Philippines. I dati fino ad 1995 anno non disponibili. Il numero di osservazioni attuali secondo i date: 20.
La fonte (nome):
Indicatori dello sviluppo mondiale
La fonte (organizzazione):
World Tourism Organization, Yearbook of Tourism Statistics, Compendium of Tourism Statistics and data files, and IMF and World Bank exports estimates.
Categorie:
Private Sector, Trade
sono stati aggiornati
23 apr 2017 anni
Indicatori delle variazioni dei valori per anni
In media:
7.422
Minima:
3.87
1 gen 1999 anni
Massimo:
11.928
1 gen 2008 anni
Alla data di osservazione
Valore
Variazione assoluta
La variazione rispetto al valore precedente
1 gen 1996 anni
4.258
+4.258
0.0%
1 gen 1997 anni
4.631
+0.373
8.76%
1 gen 1998 anni
5.814
+1.183
25.55%
1 gen 1999 anni
3.87
-1.944
-33.43%
1 gen 2000 anni
11.247
+7.377
190.6%
1 gen 2001 anni
8.499
-2.748
-24.43%
1 gen 2002 anni
8.235
-0.265
-3.11%
1 gen 2003 anni
7.462
-0.773
-9.38%
1 gen 2004 anni
6.235
-1.227
-16.45%
1 gen 2005 anni
7.34
+1.105
17.73%
1 gen 2006 anni
8.477
+1.137
15.5%
1 gen 2007 anni
9.692
+1.214
14.33%
1 gen 2008 anni
11.928
+2.236
23.07%
1 gen 2009 anni
6.899
-5.029
-42.16%
1 gen 2010 anni
6.746
-0.153
-2.22%
1 gen 2011 anni
6.308
-0.438
-6.5%
1 gen 2012 anni
7.091
+0.784
12.43%
1 gen 2013 anni
7.427
+0.336
4.73%
1 gen 2014 anni
8.252
+0.825
11.11%
1 gen 2015 anni
8.035
-0.217
-2.64%
Classificazione dei paesi secondo i statistiche attuali per anni