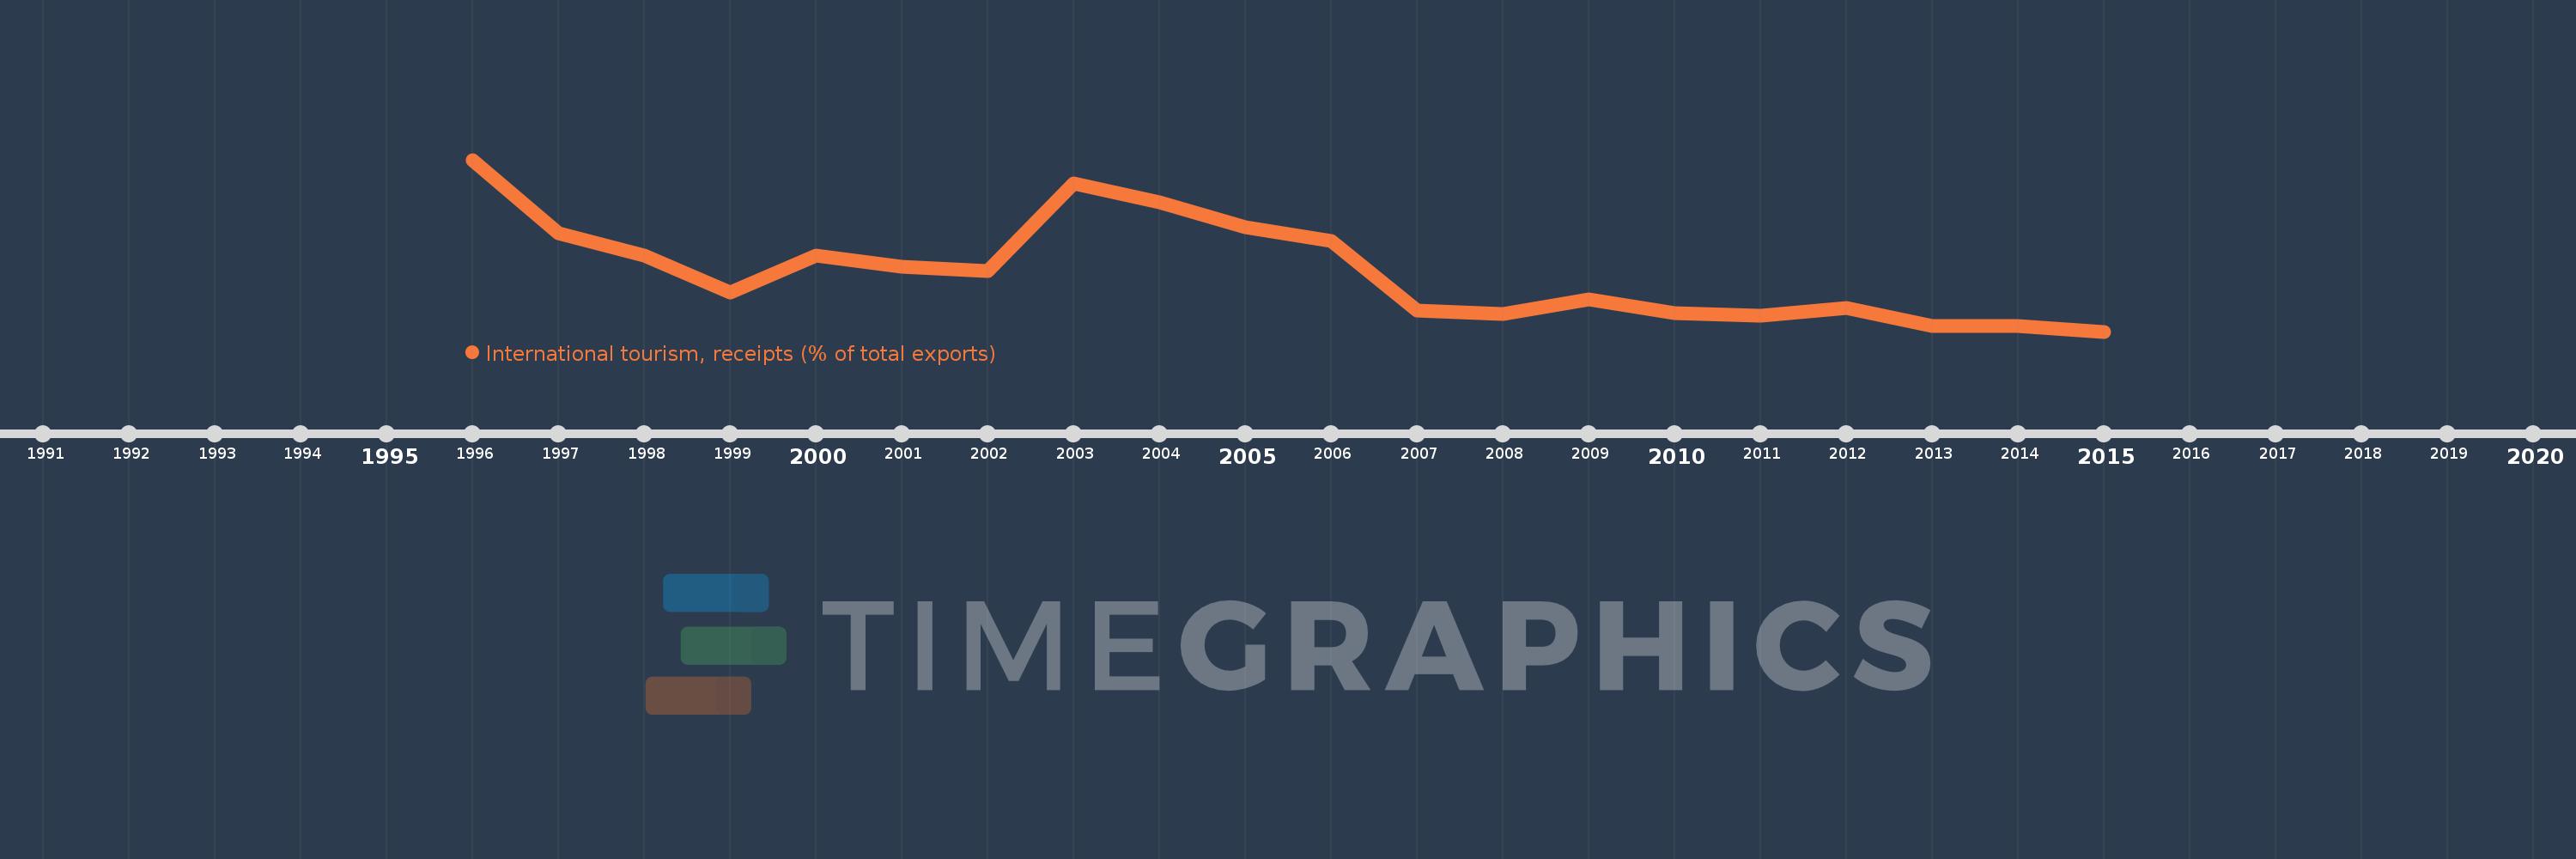
Questa scala temporale mostra un grafico dal 1996 anno al 2015 anno. Sierra Leone. I dati fino ad 1995 anno non disponibili. Il numero di osservazioni attuali secondo i date: 20.
La fonte (nome):
Indicatori dello sviluppo mondiale
La fonte (organizzazione):
World Tourism Organization, Yearbook of Tourism Statistics, Compendium of Tourism Statistics and data files, and IMF and World Bank exports estimates.
Categorie:
Private Sector, Trade
sono stati aggiornati
23 apr 2017 anni
Indicatori delle variazioni dei valori per anni
In media:
17.04
Minima:
2.355
1 gen 2015 anni
Massimo:
44.425
1 gen 1996 anni
Alla data di osservazione
Valore
Variazione assoluta
La variazione rispetto al valore precedente
1 gen 1996 anni
44.425
+44.425
0.0%
1 gen 1997 anni
26.452
-17.973
-40.46%
1 gen 1998 anni
21.007
-5.445
-20.58%
1 gen 1999 anni
11.836
-9.171
-43.66%
1 gen 2000 anni
20.956
+9.12
77.06%
1 gen 2001 anni
18.167
-2.789
-13.31%
1 gen 2002 anni
17.259
-0.908
-5.0%
1 gen 2003 anni
38.706
+21.448
124.27%
1 gen 2004 anni
33.926
-4.78
-12.35%
1 gen 2005 anni
27.936
-5.99
-17.66%
1 gen 2006 anni
24.448
-3.488
-12.49%
1 gen 2007 anni
7.603
-16.845
-68.9%
1 gen 2008 anni
6.656
-0.947
-12.45%
1 gen 2009 anni
10.289
+3.632
54.57%
1 gen 2010 anni
6.788
-3.501
-34.03%
1 gen 2011 anni
6.237
-0.551
-8.11%
1 gen 2012 anni
8.174
+1.937
31.06%
1 gen 2013 anni
3.817
-4.357
-53.31%
1 gen 2014 anni
3.756
-0.061
-1.61%
1 gen 2015 anni
2.355
-1.401
-37.3%
Classificazione dei paesi secondo i statistiche attuali per anni