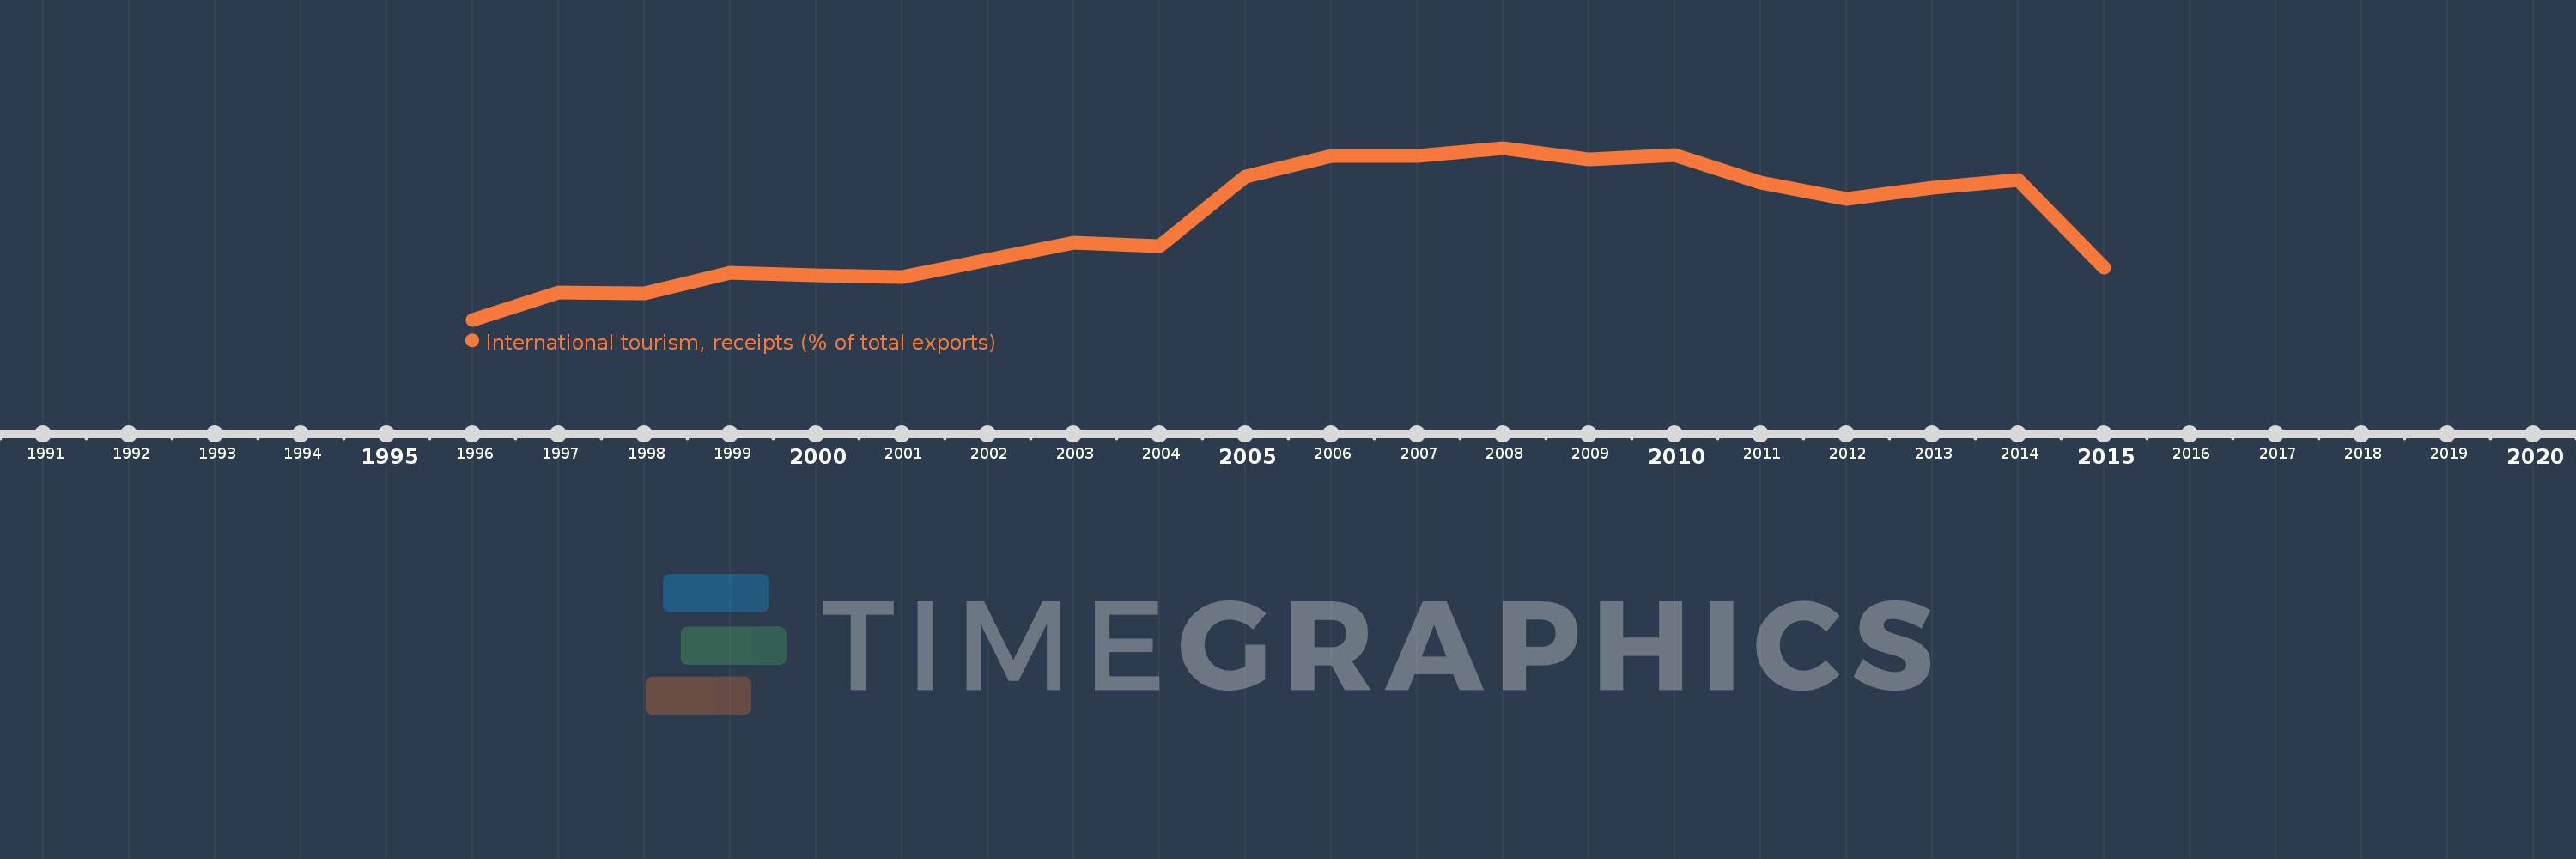
Questa scala temporale mostra un grafico dal 1996 anno al 2015 anno. Ukraine. I dati fino ad 1995 anno non disponibili. Il numero di osservazioni attuali secondo i date: 20.
La fonte (nome):
Indicatori dello sviluppo mondiale
La fonte (organizzazione):
World Tourism Organization, Yearbook of Tourism Statistics, Compendium of Tourism Statistics and data files, and IMF and World Bank exports estimates.
Categorie:
Private Sector, Trade
sono stati aggiornati
23 apr 2017 anni
Indicatori delle variazioni dei valori per anni
In media:
5.428
Minima:
1.19
1 gen 1996 anni
Massimo:
8.663
1 gen 2008 anni
Alla data di osservazione
Valore
Variazione assoluta
La variazione rispetto al valore precedente
1 gen 1996 anni
1.19
+1.19
0.0%
1 gen 1997 anni
2.392
+1.202
100.94%
1 gen 1998 anni
2.343
-0.049
-2.04%
1 gen 1999 anni
3.249
+0.905
38.63%
1 gen 2000 anni
3.13
-0.118
-3.64%
1 gen 2001 anni
3.044
-0.087
-2.77%
1 gen 2002 anni
3.796
+0.752
24.71%
1 gen 2003 anni
4.546
+0.75
19.76%
1 gen 2004 anni
4.407
-0.139
-3.05%
1 gen 2005 anni
7.428
+3.021
68.54%
1 gen 2006 anni
8.309
+0.882
11.87%
1 gen 2007 anni
8.309
0.0
0.0%
1 gen 2008 anni
8.663
+0.353
4.25%
1 gen 2009 anni
8.15
-0.513
-5.92%
1 gen 2010 anni
8.351
+0.201
2.46%
1 gen 2011 anni
7.156
-1.195
-14.31%
1 gen 2012 anni
6.462
-0.693
-9.69%
1 gen 2013 anni
6.921
+0.459
7.1%
1 gen 2014 anni
7.258
+0.337
4.86%
1 gen 2015 anni
3.458
-3.799
-52.35%
Classificazione dei paesi secondo i statistiche attuali per anni