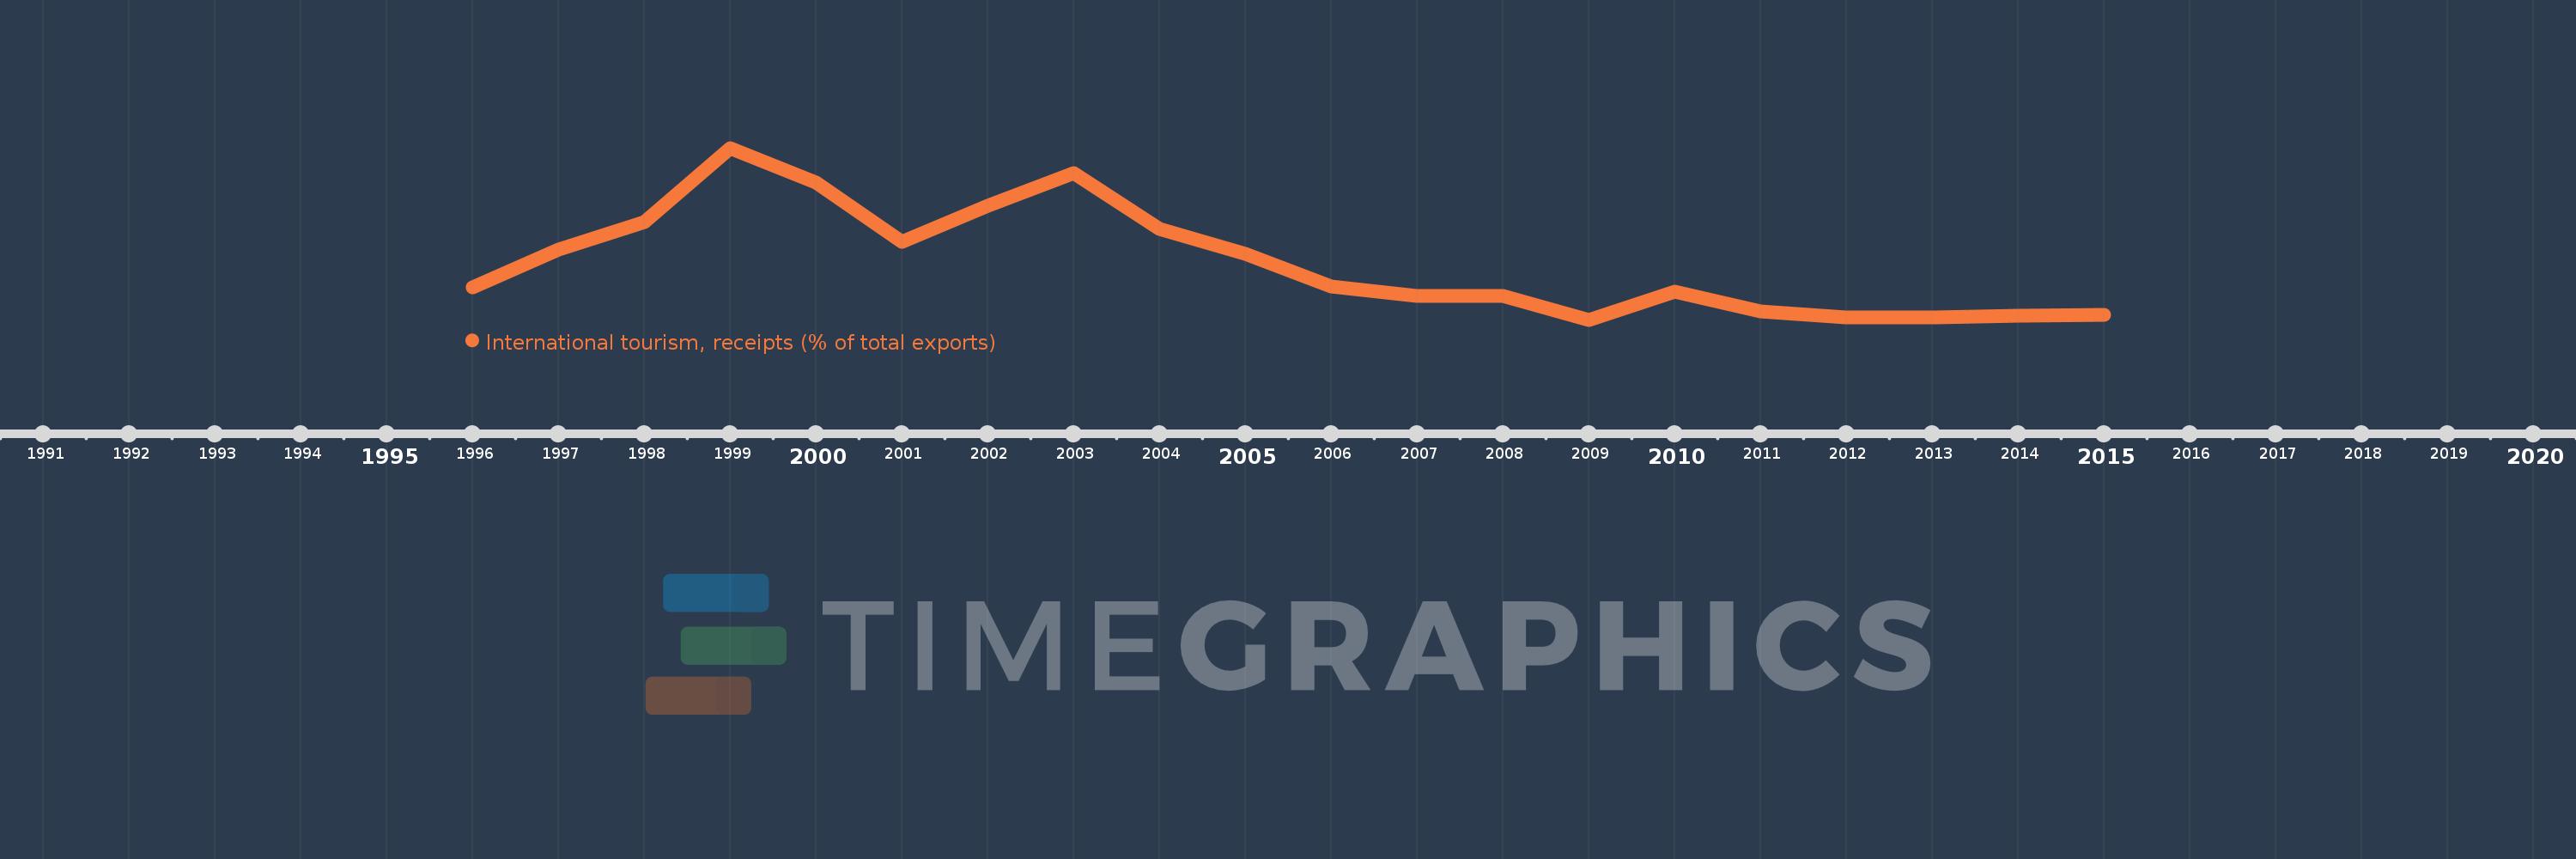
Questa scala temporale mostra un grafico dal 1996 anno al 2015 anno. Kazakhstan. I dati fino ad 1995 anno non disponibili. Il numero di osservazioni attuali secondo i date: 20.
La fonte (nome):
Indicatori dello sviluppo mondiale
La fonte (organizzazione):
World Tourism Organization, Yearbook of Tourism Statistics, Compendium of Tourism Statistics and data files, and IMF and World Bank exports estimates.
Categorie:
Private Sector, Trade
sono stati aggiornati
23 apr 2017 anni
Indicatori delle variazioni dei valori per anni
In media:
3.314
Minima:
1.646
1 gen 2009 anni
Massimo:
6.701
1 gen 1999 anni
Alla data di osservazione
Valore
Variazione assoluta
La variazione rispetto al valore precedente
1 gen 1996 anni
2.594
+2.594
0.0%
1 gen 1997 anni
3.704
+1.11
42.77%
1 gen 1998 anni
4.521
+0.818
22.07%
1 gen 1999 anni
6.701
+2.18
48.22%
1 gen 2000 anni
5.693
-1.009
-15.05%
1 gen 2001 anni
3.941
-1.752
-30.77%
1 gen 2002 anni
4.997
+1.056
26.81%
1 gen 2003 anni
5.952
+0.955
19.1%
1 gen 2004 anni
4.31
-1.642
-27.58%
1 gen 2005 anni
3.574
-0.736
-17.09%
1 gen 2006 anni
2.636
-0.938
-26.24%
1 gen 2007 anni
2.348
-0.288
-10.92%
1 gen 2008 anni
2.345
-0.003
-0.14%
1 gen 2009 anni
1.646
-0.699
-29.81%
1 gen 2010 anni
2.467
+0.822
49.92%
1 gen 2011 anni
1.887
-0.581
-23.53%
1 gen 2012 anni
1.702
-0.185
-9.78%
1 gen 2013 anni
1.713
+0.011
0.65%
1 gen 2014 anni
1.761
+0.048
2.81%
1 gen 2015 anni
1.789
+0.027
1.56%
Classificazione dei paesi secondo i statistiche attuali per anni