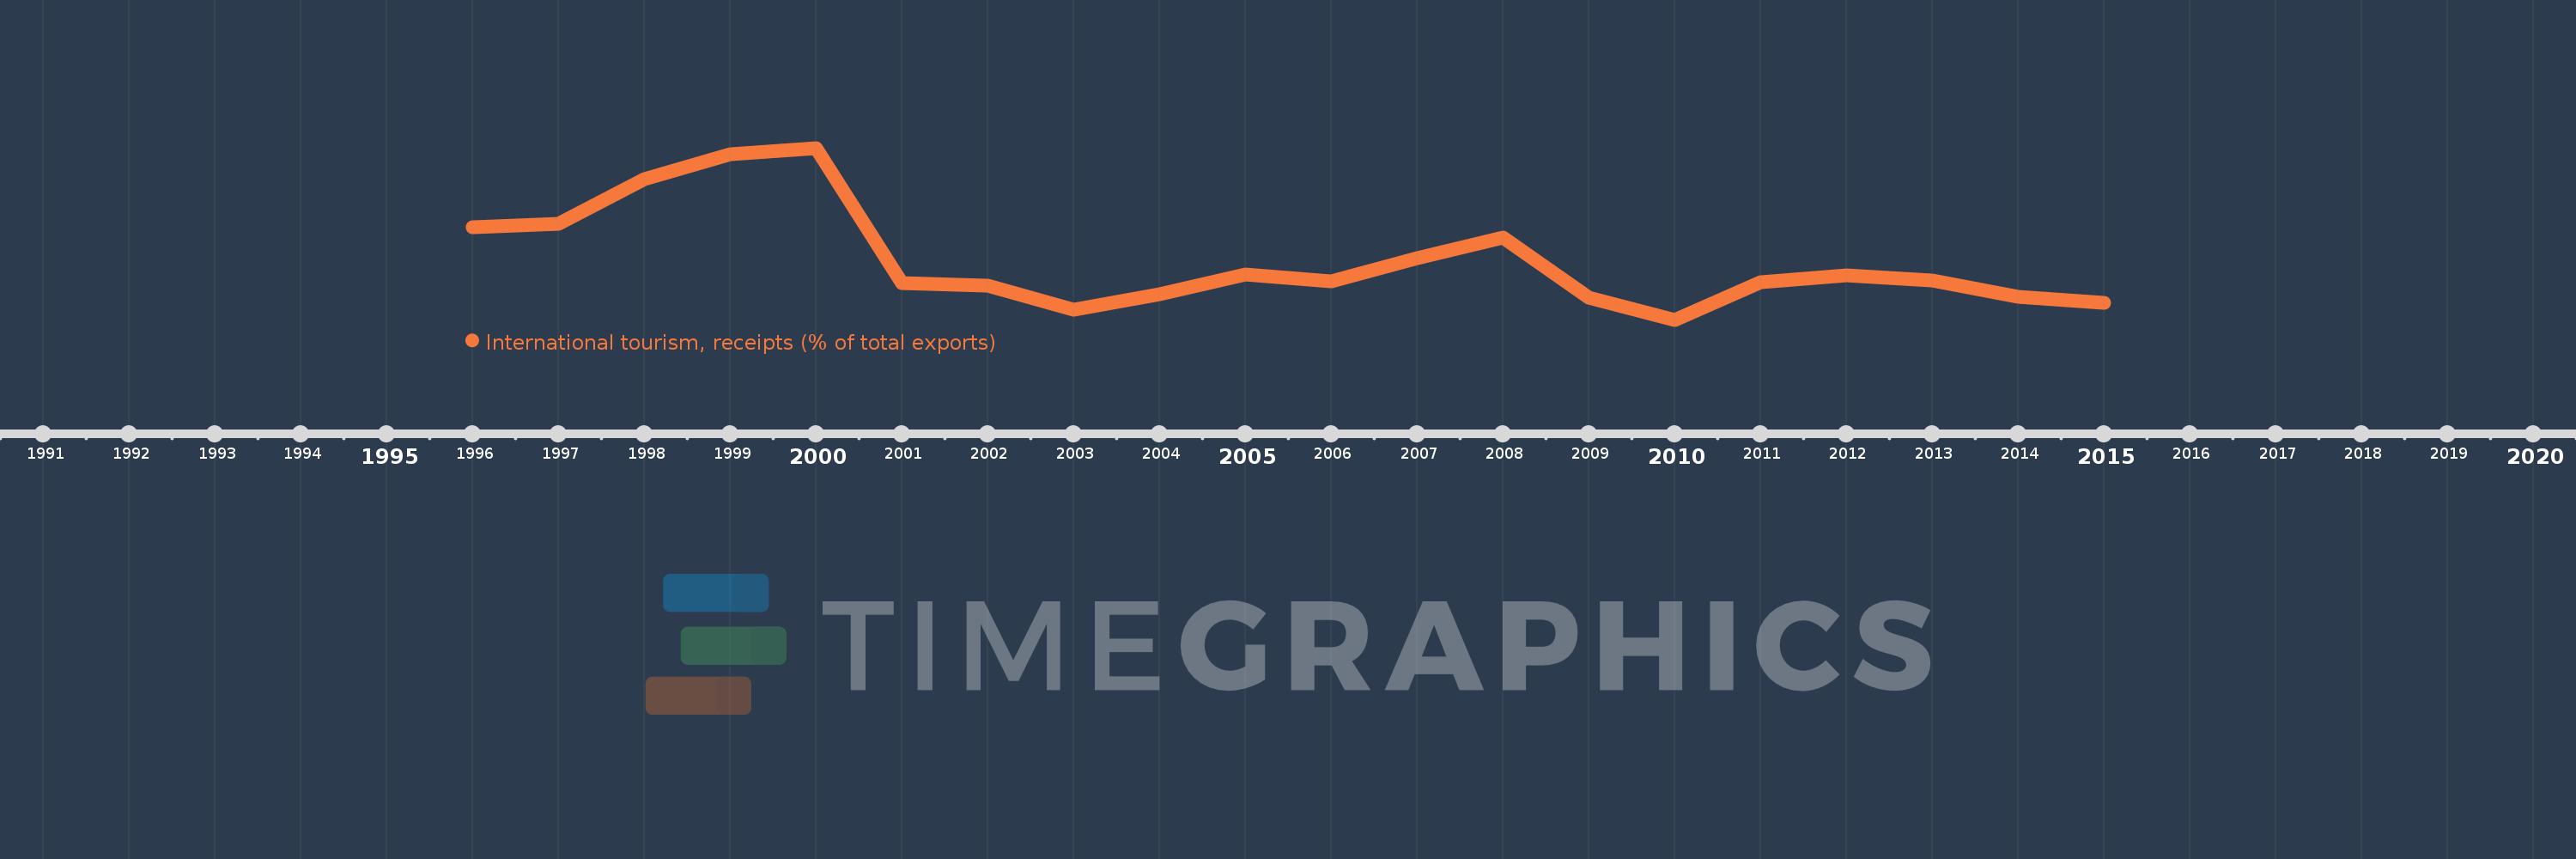
Questa scala temporale mostra un grafico dal 1996 anno al 2015 anno. Kenya. I dati fino ad 1995 anno non disponibili. Il numero di osservazioni attuali secondo i date: 20.
La fonte (nome):
Indicatori dello sviluppo mondiale
La fonte (organizzazione):
World Tourism Organization, Yearbook of Tourism Statistics, Compendium of Tourism Statistics and data files, and IMF and World Bank exports estimates.
Categorie:
Private Sector, Trade
sono stati aggiornati
23 apr 2017 anni
Indicatori delle variazioni dei valori per anni
In media:
19.701
Minima:
15.22
1 gen 2010 anni
Massimo:
28.246
1 gen 2000 anni
Alla data di osservazione
Valore
Variazione assoluta
La variazione rispetto al valore precedente
1 gen 1996 anni
22.265
+22.265
0.0%
1 gen 1997 anni
22.473
+0.208
0.94%
1 gen 1998 anni
25.892
+3.419
15.21%
1 gen 1999 anni
27.758
+1.865
7.2%
1 gen 2000 anni
28.246
+0.488
1.76%
1 gen 2001 anni
18.014
-10.232
-36.22%
1 gen 2002 anni
17.798
-0.216
-1.2%
1 gen 2003 anni
15.953
-1.845
-10.37%
1 gen 2004 anni
17.147
+1.194
7.49%
1 gen 2005 anni
18.657
+1.51
8.81%
1 gen 2006 anni
18.138
-0.519
-2.78%
1 gen 2007 anni
19.863
+1.724
9.51%
1 gen 2008 anni
21.436
+1.573
7.92%
1 gen 2009 anni
16.863
-4.574
-21.34%
1 gen 2010 anni
15.22
-1.643
-9.74%
1 gen 2011 anni
18.034
+2.814
18.49%
1 gen 2012 anni
18.614
+0.58
3.22%
1 gen 2013 anni
18.176
-0.439
-2.36%
1 gen 2014 anni
16.972
-1.204
-6.62%
1 gen 2015 anni
16.5
-0.472
-2.78%
Classificazione dei paesi secondo i statistiche attuali per anni