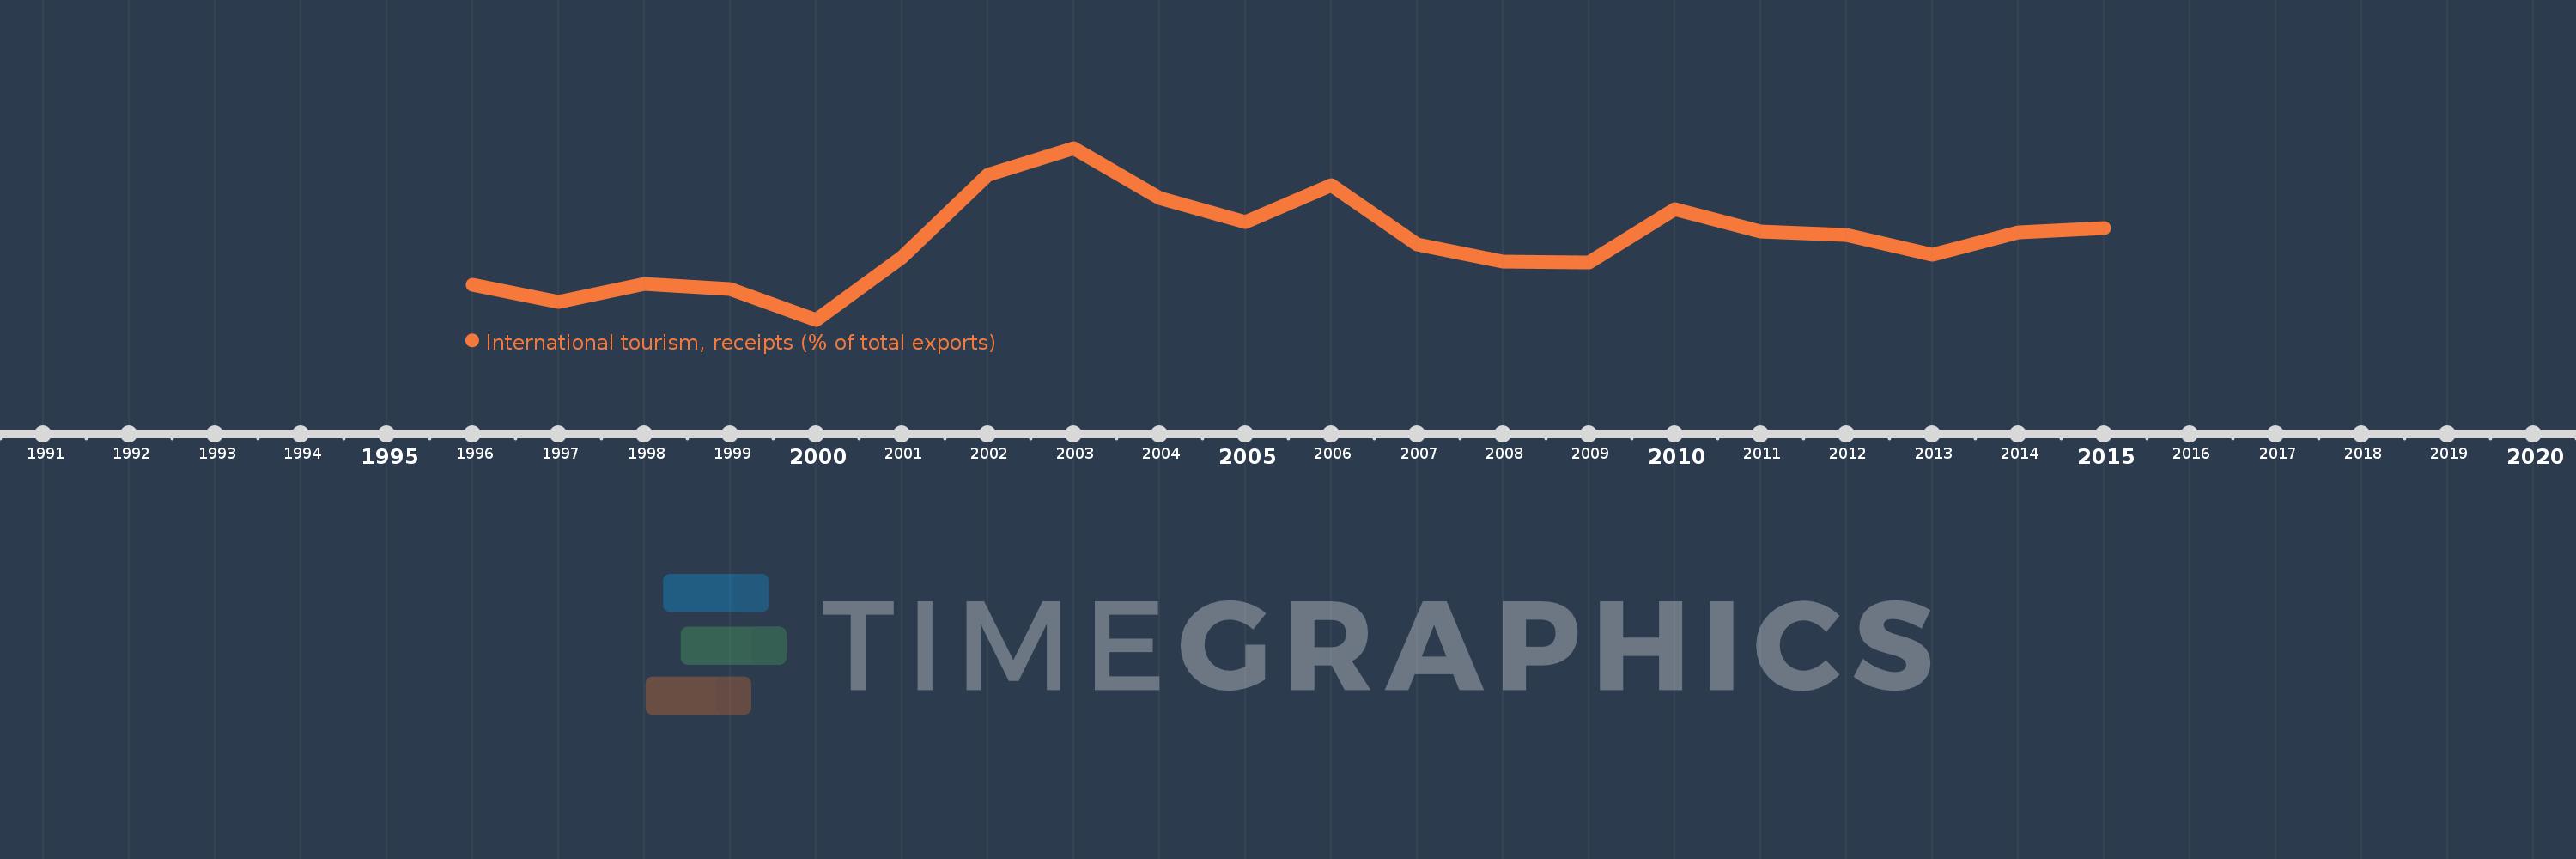
Questa scala temporale mostra un grafico dal 1996 anno al 2015 anno. Turkey. I dati fino ad 1995 anno non disponibili. Il numero di osservazioni attuali secondo i date: 20.
La fonte (nome):
Indicatori dello sviluppo mondiale
La fonte (organizzazione):
World Tourism Organization, Yearbook of Tourism Statistics, Compendium of Tourism Statistics and data files, and IMF and World Bank exports estimates.
Categorie:
Private Sector, Trade
sono stati aggiornati
23 apr 2017 anni
Indicatori delle variazioni dei valori per anni
In media:
16.147
Minima:
11.44
1 gen 2000 anni
Massimo:
21.737
1 gen 2003 anni
Alla data di osservazione
Valore
Variazione assoluta
La variazione rispetto al valore precedente
1 gen 1996 anni
13.551
+13.551
0.0%
1 gen 1997 anni
12.514
-1.037
-7.65%
1 gen 1998 anni
13.589
+1.075
8.59%
1 gen 1999 anni
13.262
-0.327
-2.4%
1 gen 2000 anni
11.44
-1.822
-13.74%
1 gen 2001 anni
15.165
+3.725
32.56%
1 gen 2002 anni
20.149
+4.984
32.87%
1 gen 2003 anni
21.737
+1.588
7.88%
1 gen 2004 anni
18.727
-3.01
-13.85%
1 gen 2005 anni
17.285
-1.442
-7.7%
1 gen 2006 anni
19.524
+2.239
12.95%
1 gen 2007 anni
15.965
-3.558
-18.23%
1 gen 2008 anni
14.9
-1.066
-6.67%
1 gen 2009 anni
14.856
-0.044
-0.29%
1 gen 2010 anni
18.091
+3.235
21.78%
1 gen 2011 anni
16.716
-1.375
-7.6%
1 gen 2012 anni
16.5
-0.216
-1.29%
1 gen 2013 anni
15.359
-1.14
-6.91%
1 gen 2014 anni
16.685
+1.326
8.63%
1 gen 2015 anni
16.927
+0.241
1.45%
Classificazione dei paesi secondo i statistiche attuali per anni