29
/
en
AIzaSyAYiBZKx7MnpbEhh9jyipgxe19OcubqV5w
April 1, 2024
93096
Brunei Darussalam
BRN
true
2
1
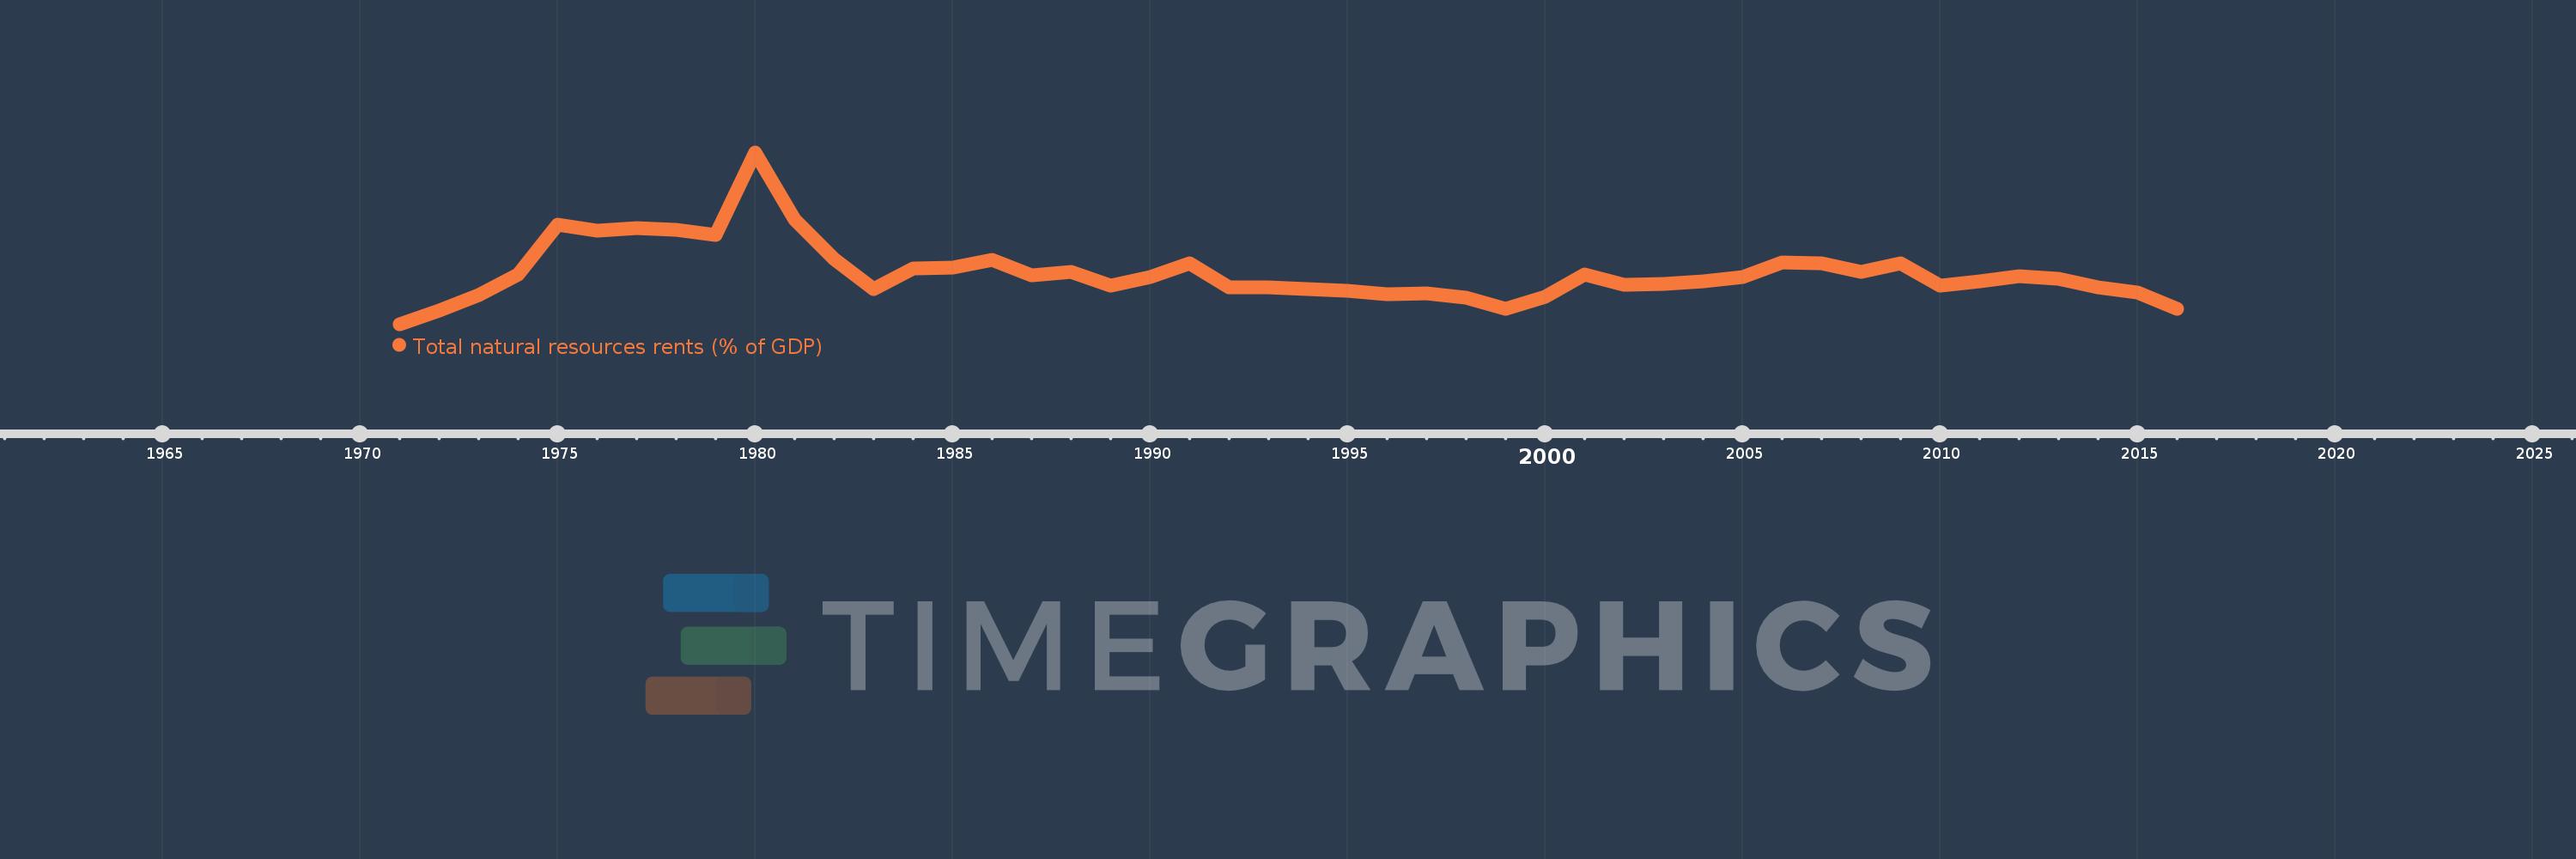
Total natural resources rents (% of GDP)
2016,2015,2014,2013,2012,2011,2010,2009,2008,2007,2006,2005,2004,2003,2002,2001,2000,1999,1998,1997,1996,1995,1994,1993,1992,1991,1990,1989,1988,1987,1986,1985,1984,1983,1982,1981,1980,1979,1978,1977,1976,1975,1974,1973,1972,1971
This statistics in other country:
AfghanistanAlbaniaAlgeriaAngolaArab WorldArgentinaArmeniaArubaAustraliaAustriaAzerbaijanBahamas, TheBahrainBangladeshBarbadosBelarusBelgiumBelizeBeninBhutanBoliviaBosnia and HerzegovinaBotswanaBrazilBrunei DarussalamBulgariaBurkina FasoBurundiCabo VerdeCambodiaCameroonCanadaCaribbean small statesCentral African RepublicCentral Europe and the BalticsChadChileChinaColombiaComorosCongo, Dem. Rep.Congo, Rep.Costa RicaCote d'IvoireCroatiaCubaCyprusCzech RepublicDenmarkDjiboutiDominicaDominican RepublicEarly-demographic dividendEast Asia & PacificEast Asia & Pacific (excluding high income)East Asia & Pacific (IDA & IBRD countries)EcuadorEgypt, Arab Rep.El SalvadorEquatorial GuineaEritreaEstoniaEthiopiaEuro areaEurope & Central AsiaEurope & Central Asia (excluding high income)Europe & Central Asia (IDA & IBRD countries)European UnionFijiFinlandFragile and conflict affected situationsFranceFrench PolynesiaGabonGambia, TheGeorgiaGermanyGhanaGreeceGuatemalaGuineaGuinea-BissauGuyanaHaitiHeavily indebted poor countries (HIPC)High incomeHondurasHong Kong SAR, ChinaHungaryIBRD onlyIcelandIDA & IBRD totalIDA blendIDA onlyIDA totalIndiaIndonesiaIran, Islamic Rep.IraqIrelandIsraelItalyJamaicaJapanJordanKazakhstanKenyaKiribatiKorea, Rep.KuwaitKyrgyz RepublicLao PDRLate-demographic dividendLatin America & Caribbean Latin America & Caribbean (excluding high income)Latin America & the Caribbean (IDA & IBRD countries)LatviaLeast developed countries: UN classificationLebanonLesothoLiberiaLibyaLithuaniaLow & middle incomeLow incomeLower middle incomeLuxembourgMacao SAR, ChinaMacedonia, FYRMadagascarMalawiMalaysiaMaldivesMaliMaltaMauritaniaMauritiusMexicoMiddle East & North AfricaMiddle East & North Africa (excluding high income)Middle East & North Africa (IDA & IBRD countries)Middle incomeMoldovaMongoliaMontenegroMoroccoMozambiqueMyanmarNamibiaNepalNetherlandsNew CaledoniaNew ZealandNicaraguaNigerNigeriaNorth AmericaNorwayOECD membersOmanOther small statesPacific island small statesPakistanPanamaPapua New GuineaParaguayPeruPhilippinesPolandPortugalPost-demographic dividendPre-demographic dividendQatarRomaniaRussian FederationRwandaSamoaSao Tome and PrincipeSaudi ArabiaSenegalSerbiaSeychellesSierra LeoneSingaporeSlovak RepublicSloveniaSmall statesSolomon IslandsSouth AfricaSouth AsiaSouth Asia (IDA & IBRD)South SudanSpainSri LankaSt. LuciaSt. Vincent and the GrenadinesSub-Saharan Africa Sub-Saharan Africa (excluding high income)Sub-Saharan Africa (IDA & IBRD countries)SudanSurinameSwazilandSwedenSwitzerlandSyrian Arab RepublicTajikistanTanzaniaThailandTimor-LesteTogoTongaTrinidad and TobagoTunisiaTurkeyTurkmenistanUgandaUkraineUnited Arab EmiratesUnited KingdomUnited StatesUpper middle incomeUruguayUzbekistanVanuatuVenezuela, RBVietnamWorldYemen, Rep.ZambiaZimbabwe Timeline:
This timeline shows a graph from 1971 to 2016 of Brunei Darussalam. No data until 1970. Number of actual observations by date: 46.
Source name:
World Development Indicators
Source organization:
Estimates based on sources and methods described in "The Changing Wealth of Nations: Measuring Sustainable Development in the New Millennium" (World Bank, 2011).
Categories, topics:
Energy & Mining, Environment
Last updated:
apr 23, 2017
Indicators value changes by year
Maximum:
89.255
jan 1, 1980
At the date of observation
Value
Absolute change
Change from previous value
jan 1, 1971
0.381
+0.381
0.0%
jan 1, 1972
7.376
+6.994
1.83K%
jan 1, 1973
15.261
+7.886
106.92%
jan 1, 1974
26.244
+10.983
71.96%
jan 1, 1975
51.904
+25.66
97.78%
jan 1, 1976
48.587
-3.317
-6.39%
jan 1, 1977
49.986
+1.399
2.88%
jan 1, 1978
49.067
-0.919
-1.84%
jan 1, 1979
46.636
-2.431
-4.95%
jan 1, 1980
89.255
+42.619
91.39%
jan 1, 1981
54.371
-34.884
-39.08%
jan 1, 1982
34.273
-20.099
-36.97%
jan 1, 1983
18.447
-15.825
-46.17%
jan 1, 1984
29.083
+10.635
57.65%
jan 1, 1985
29.803
+0.721
2.48%
jan 1, 1986
33.823
+4.02
13.49%
jan 1, 1987
25.807
-8.016
-23.7%
jan 1, 1988
27.345
+1.538
5.96%
jan 1, 1989
20.235
-7.11
-26.0%
jan 1, 1990
24.756
+4.521
22.34%
jan 1, 1991
31.916
+7.16
28.92%
jan 1, 1992
19.442
-12.474
-39.08%
jan 1, 1993
19.37
-0.072
-0.37%
jan 1, 1994
18.589
-0.78
-4.03%
jan 1, 1995
17.54
-1.049
-5.64%
jan 1, 1996
15.766
-1.774
-10.11%
jan 1, 1997
16.5
+0.734
4.66%
jan 1, 1998
14.11
-2.39
-14.49%
jan 1, 1999
8.395
-5.715
-40.5%
jan 1, 2000
14.668
+6.273
74.72%
jan 1, 2001
25.979
+11.311
77.11%
jan 1, 2002
20.947
-5.032
-19.37%
jan 1, 2003
21.327
+0.38
1.81%
jan 1, 2004
22.744
+1.417
6.64%
jan 1, 2005
24.712
+1.968
8.65%
jan 1, 2006
32.222
+7.51
30.39%
jan 1, 2007
31.72
-0.502
-1.56%
jan 1, 2008
27.531
-4.189
-13.2%
jan 1, 2009
32.01
+4.479
16.27%
jan 1, 2010
20.35
-11.66
-36.43%
jan 1, 2011
22.476
+2.127
10.45%
jan 1, 2012
25.164
+2.688
11.96%
jan 1, 2013
24.058
-1.106
-4.39%
jan 1, 2014
19.421
-4.638
-19.28%
jan 1, 2015
16.605
-2.816
-14.5%
jan 1, 2016
8.544
-8.061
-48.55%
Ranking of countries by current statistics by years


Comments: