29
/
en
AIzaSyAYiBZKx7MnpbEhh9jyipgxe19OcubqV5w
April 1, 2024
219158
Panama
PAN
true
2
1
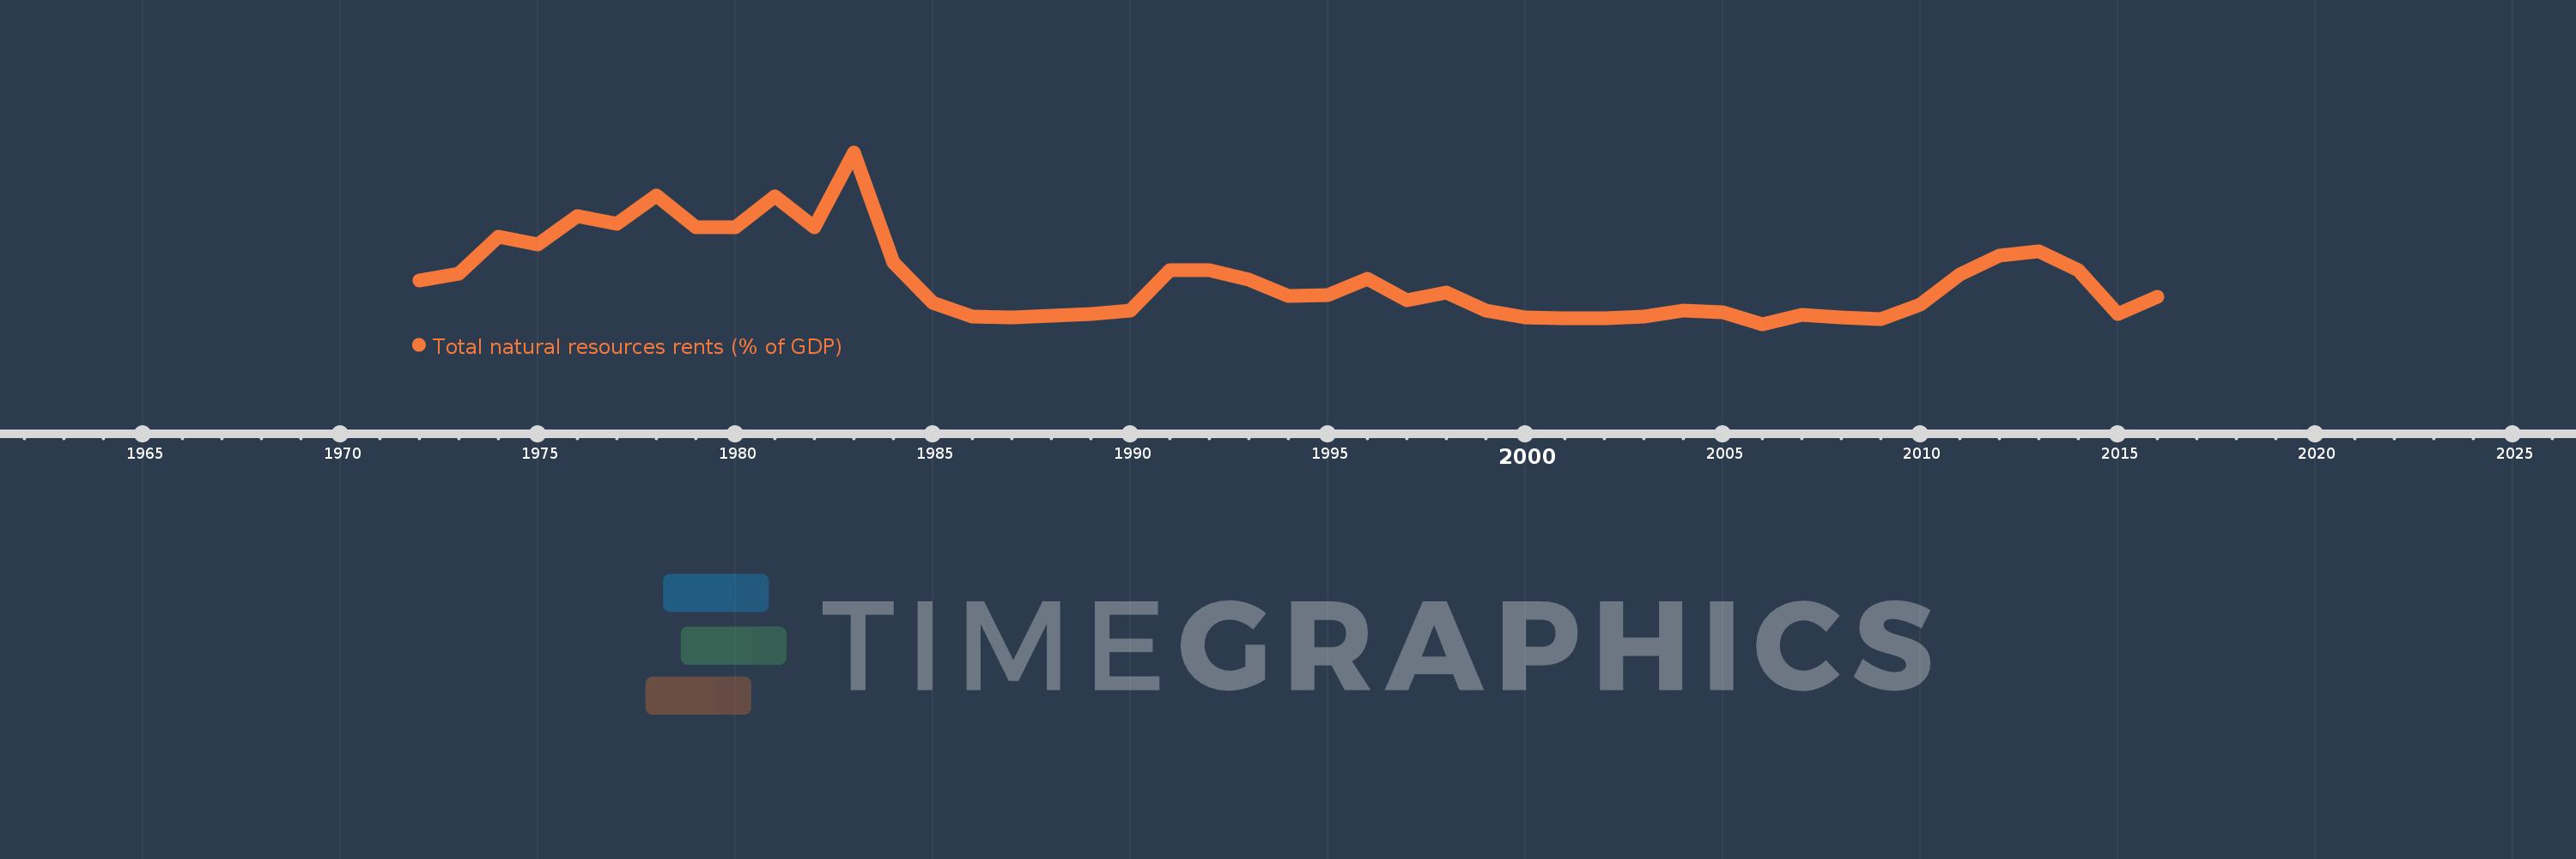
Total natural resources rents (% of GDP)
2016,2015,2014,2013,2012,2011,2010,2009,2008,2007,2006,2005,2004,2003,2002,2001,2000,1999,1998,1997,1996,1995,1994,1993,1992,1991,1990,1989,1988,1987,1986,1985,1984,1983,1982,1981,1980,1979,1978,1977,1976,1975,1974,1973,1972
This statistics in other country:
AfghanistanAlbaniaAlgeriaAngolaArab WorldArgentinaArmeniaArubaAustraliaAustriaAzerbaijanBahamas, TheBahrainBangladeshBarbadosBelarusBelgiumBelizeBeninBhutanBoliviaBosnia and HerzegovinaBotswanaBrazilBrunei DarussalamBulgariaBurkina FasoBurundiCabo VerdeCambodiaCameroonCanadaCaribbean small statesCentral African RepublicCentral Europe and the BalticsChadChileChinaColombiaComorosCongo, Dem. Rep.Congo, Rep.Costa RicaCote d'IvoireCroatiaCubaCyprusCzech RepublicDenmarkDjiboutiDominicaDominican RepublicEarly-demographic dividendEast Asia & PacificEast Asia & Pacific (excluding high income)East Asia & Pacific (IDA & IBRD countries)EcuadorEgypt, Arab Rep.El SalvadorEquatorial GuineaEritreaEstoniaEthiopiaEuro areaEurope & Central AsiaEurope & Central Asia (excluding high income)Europe & Central Asia (IDA & IBRD countries)European UnionFijiFinlandFragile and conflict affected situationsFranceFrench PolynesiaGabonGambia, TheGeorgiaGermanyGhanaGreeceGuatemalaGuineaGuinea-BissauGuyanaHaitiHeavily indebted poor countries (HIPC)High incomeHondurasHong Kong SAR, ChinaHungaryIBRD onlyIcelandIDA & IBRD totalIDA blendIDA onlyIDA totalIndiaIndonesiaIran, Islamic Rep.IraqIrelandIsraelItalyJamaicaJapanJordanKazakhstanKenyaKiribatiKorea, Rep.KuwaitKyrgyz RepublicLao PDRLate-demographic dividendLatin America & Caribbean Latin America & Caribbean (excluding high income)Latin America & the Caribbean (IDA & IBRD countries)LatviaLeast developed countries: UN classificationLebanonLesothoLiberiaLibyaLithuaniaLow & middle incomeLow incomeLower middle incomeLuxembourgMacao SAR, ChinaMacedonia, FYRMadagascarMalawiMalaysiaMaldivesMaliMaltaMauritaniaMauritiusMexicoMiddle East & North AfricaMiddle East & North Africa (excluding high income)Middle East & North Africa (IDA & IBRD countries)Middle incomeMoldovaMongoliaMontenegroMoroccoMozambiqueMyanmarNamibiaNepalNetherlandsNew CaledoniaNew ZealandNicaraguaNigerNigeriaNorth AmericaNorwayOECD membersOmanOther small statesPacific island small statesPakistanPanamaPapua New GuineaParaguayPeruPhilippinesPolandPortugalPost-demographic dividendPre-demographic dividendQatarRomaniaRussian FederationRwandaSamoaSao Tome and PrincipeSaudi ArabiaSenegalSerbiaSeychellesSierra LeoneSingaporeSlovak RepublicSloveniaSmall statesSolomon IslandsSouth AfricaSouth AsiaSouth Asia (IDA & IBRD)South SudanSpainSri LankaSt. LuciaSt. Vincent and the GrenadinesSub-Saharan Africa Sub-Saharan Africa (excluding high income)Sub-Saharan Africa (IDA & IBRD countries)SudanSurinameSwazilandSwedenSwitzerlandSyrian Arab RepublicTajikistanTanzaniaThailandTimor-LesteTogoTongaTrinidad and TobagoTunisiaTurkeyTurkmenistanUgandaUkraineUnited Arab EmiratesUnited KingdomUnited StatesUpper middle incomeUruguayUzbekistanVanuatuVenezuela, RBVietnamWorldYemen, Rep.ZambiaZimbabwe Timeline:
This timeline shows a graph from 1972 to 2016 of Panama. No data until 1971. Number of actual observations by date: 45.
Source name:
World Development Indicators
Source organization:
Estimates based on sources and methods described in "The Changing Wealth of Nations: Measuring Sustainable Development in the New Millennium" (World Bank, 2011).
Categories, topics:
Energy & Mining, Environment
Last updated:
apr 23, 2017
Indicators value changes by year
At the date of observation
Value
Absolute change
Change from previous value
jan 1, 1972
0.238
+0.238
0.0%
jan 1, 1973
0.259
+0.021
8.77%
jan 1, 1974
0.378
+0.119
45.8%
jan 1, 1975
0.353
-0.025
-6.58%
jan 1, 1976
0.446
+0.093
26.37%
jan 1, 1977
0.42
-0.026
-5.88%
jan 1, 1978
0.512
+0.092
21.92%
jan 1, 1979
0.409
-0.102
-20.01%
jan 1, 1980
0.411
+0.002
0.4%
jan 1, 1981
0.509
+0.098
23.87%
jan 1, 1982
0.409
-0.1
-19.64%
jan 1, 1983
0.651
+0.242
59.02%
jan 1, 1984
0.295
-0.356
-54.64%
jan 1, 1985
0.167
-0.129
-43.58%
jan 1, 1986
0.123
-0.043
-25.89%
jan 1, 1987
0.12
-0.004
-3.17%
jan 1, 1988
0.125
+0.005
4.2%
jan 1, 1989
0.13
+0.005
4.16%
jan 1, 1990
0.141
+0.011
8.74%
jan 1, 1991
0.27
+0.129
91.43%
jan 1, 1992
0.271
+0.0
0.18%
jan 1, 1993
0.241
-0.029
-10.75%
jan 1, 1994
0.187
-0.054
-22.56%
jan 1, 1995
0.191
+0.004
1.92%
jan 1, 1996
0.244
+0.053
27.96%
jan 1, 1997
0.174
-0.069
-28.5%
jan 1, 1998
0.2
+0.025
14.44%
jan 1, 1999
0.141
-0.059
-29.33%
jan 1, 2000
0.12
-0.021
-15.21%
jan 1, 2001
0.115
-0.005
-3.92%
jan 1, 2002
0.117
+0.002
1.63%
jan 1, 2003
0.123
+0.006
4.99%
jan 1, 2004
0.14
+0.017
14.26%
jan 1, 2005
0.136
-0.004
-3.11%
jan 1, 2006
0.097
-0.038
-28.36%
jan 1, 2007
0.127
+0.03
30.89%
jan 1, 2008
0.12
-0.008
-5.99%
jan 1, 2009
0.112
-0.007
-6.08%
jan 1, 2010
0.16
+0.048
42.72%
jan 1, 2011
0.257
+0.097
60.5%
jan 1, 2012
0.317
+0.059
23.05%
jan 1, 2013
0.332
+0.016
4.95%
jan 1, 2014
0.272
-0.06
-18.19%
jan 1, 2015
0.131
-0.141
-51.97%
jan 1, 2016
0.186
+0.056
42.8%
Ranking of countries by current statistics by years


Comments: