29
/
en
AIzaSyAYiBZKx7MnpbEhh9jyipgxe19OcubqV5w
April 1, 2024
37851
IDA & IBRD total
IBT
false
2
1
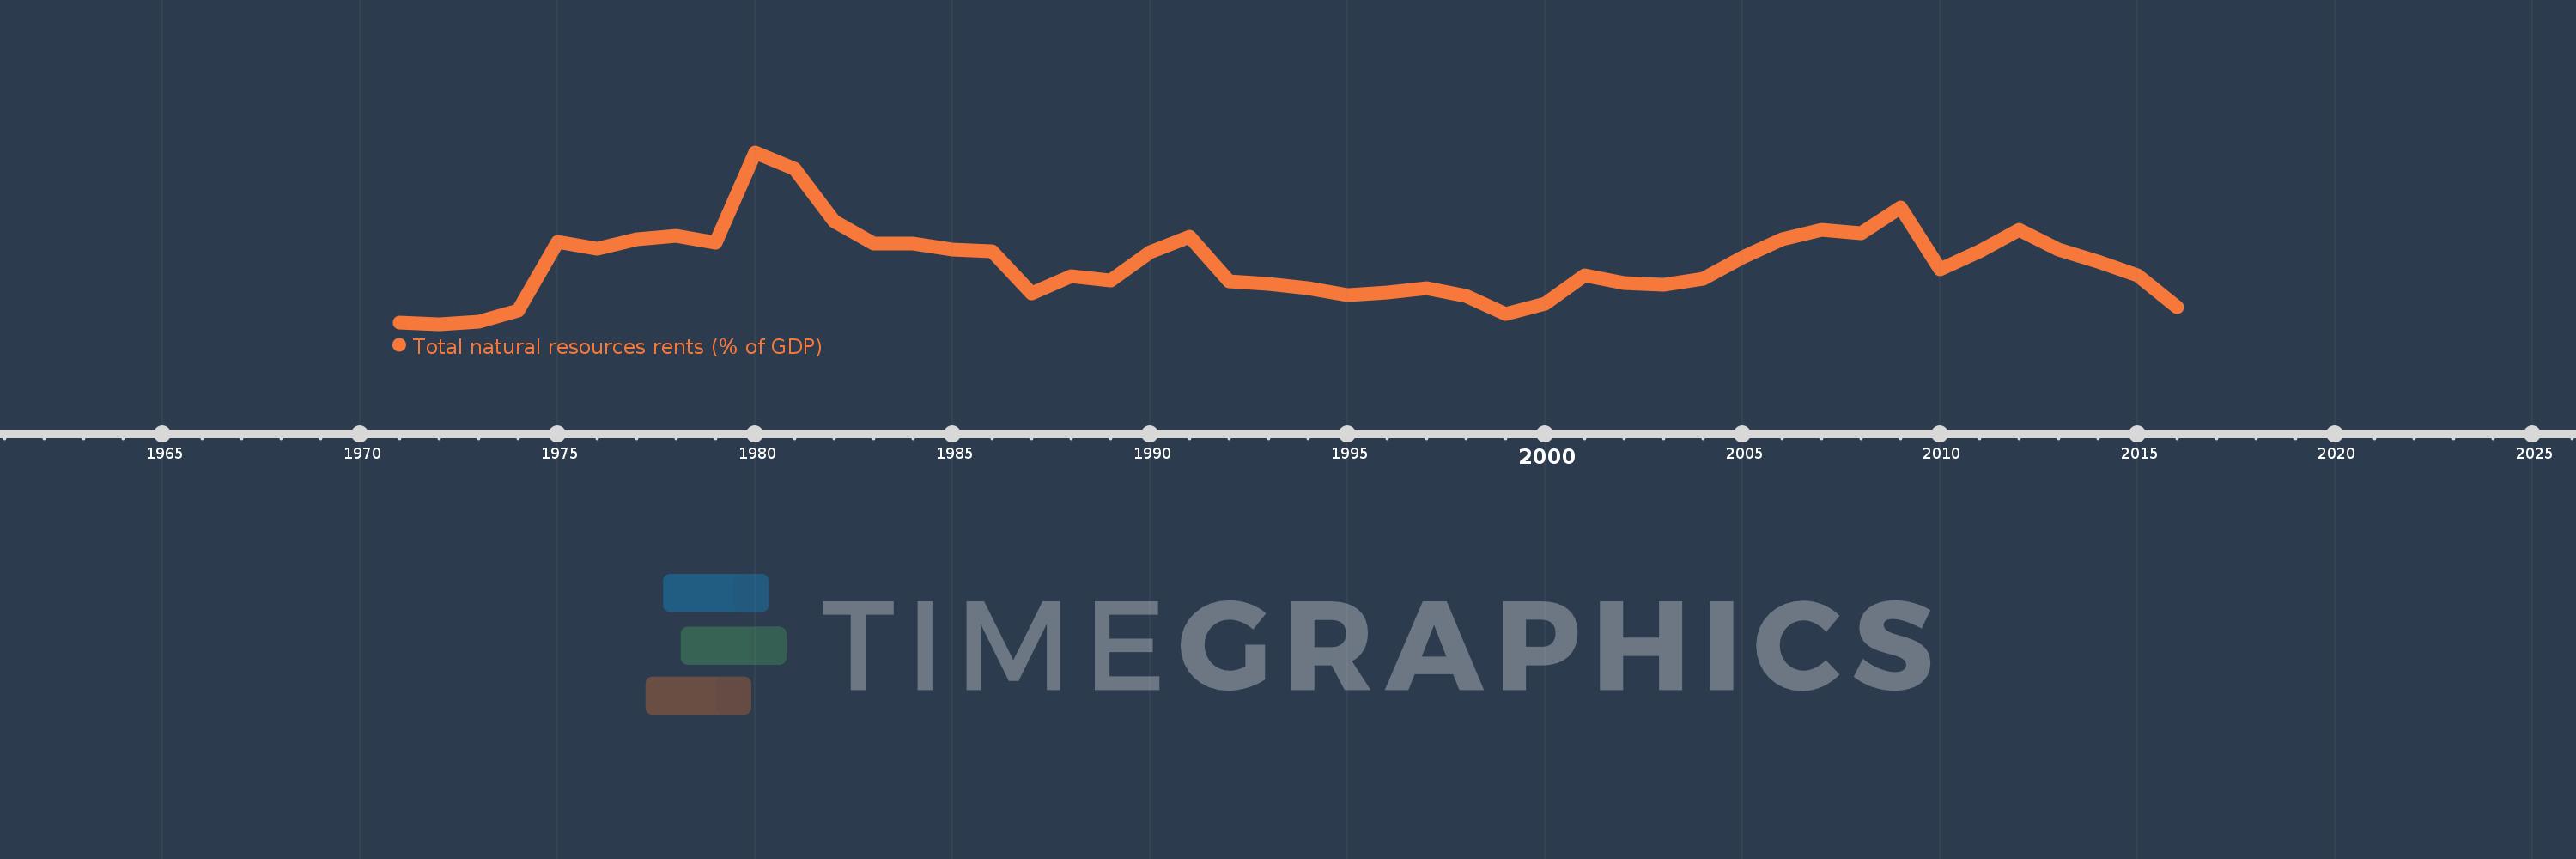
Total natural resources rents (% of GDP)
2016,2015,2014,2013,2012,2011,2010,2009,2008,2007,2006,2005,2004,2003,2002,2001,2000,1999,1998,1997,1996,1995,1994,1993,1992,1991,1990,1989,1988,1987,1986,1985,1984,1983,1982,1981,1980,1979,1978,1977,1976,1975,1974,1973,1972,1971
This statistics in other country:
AfghanistanAlbaniaAlgeriaAngolaArab WorldArgentinaArmeniaArubaAustraliaAustriaAzerbaijanBahamas, TheBahrainBangladeshBarbadosBelarusBelgiumBelizeBeninBhutanBoliviaBosnia and HerzegovinaBotswanaBrazilBrunei DarussalamBulgariaBurkina FasoBurundiCabo VerdeCambodiaCameroonCanadaCaribbean small statesCentral African RepublicCentral Europe and the BalticsChadChileChinaColombiaComorosCongo, Dem. Rep.Congo, Rep.Costa RicaCote d'IvoireCroatiaCubaCyprusCzech RepublicDenmarkDjiboutiDominicaDominican RepublicEarly-demographic dividendEast Asia & PacificEast Asia & Pacific (excluding high income)East Asia & Pacific (IDA & IBRD countries)EcuadorEgypt, Arab Rep.El SalvadorEquatorial GuineaEritreaEstoniaEthiopiaEuro areaEurope & Central AsiaEurope & Central Asia (excluding high income)Europe & Central Asia (IDA & IBRD countries)European UnionFijiFinlandFragile and conflict affected situationsFranceFrench PolynesiaGabonGambia, TheGeorgiaGermanyGhanaGreeceGuatemalaGuineaGuinea-BissauGuyanaHaitiHeavily indebted poor countries (HIPC)High incomeHondurasHong Kong SAR, ChinaHungaryIBRD onlyIcelandIDA & IBRD totalIDA blendIDA onlyIDA totalIndiaIndonesiaIran, Islamic Rep.IraqIrelandIsraelItalyJamaicaJapanJordanKazakhstanKenyaKiribatiKorea, Rep.KuwaitKyrgyz RepublicLao PDRLate-demographic dividendLatin America & Caribbean Latin America & Caribbean (excluding high income)Latin America & the Caribbean (IDA & IBRD countries)LatviaLeast developed countries: UN classificationLebanonLesothoLiberiaLibyaLithuaniaLow & middle incomeLow incomeLower middle incomeLuxembourgMacao SAR, ChinaMacedonia, FYRMadagascarMalawiMalaysiaMaldivesMaliMaltaMauritaniaMauritiusMexicoMiddle East & North AfricaMiddle East & North Africa (excluding high income)Middle East & North Africa (IDA & IBRD countries)Middle incomeMoldovaMongoliaMontenegroMoroccoMozambiqueMyanmarNamibiaNepalNetherlandsNew CaledoniaNew ZealandNicaraguaNigerNigeriaNorth AmericaNorwayOECD membersOmanOther small statesPacific island small statesPakistanPanamaPapua New GuineaParaguayPeruPhilippinesPolandPortugalPost-demographic dividendPre-demographic dividendQatarRomaniaRussian FederationRwandaSamoaSao Tome and PrincipeSaudi ArabiaSenegalSerbiaSeychellesSierra LeoneSingaporeSlovak RepublicSloveniaSmall statesSolomon IslandsSouth AfricaSouth AsiaSouth Asia (IDA & IBRD)South SudanSpainSri LankaSt. LuciaSt. Vincent and the GrenadinesSub-Saharan Africa Sub-Saharan Africa (excluding high income)Sub-Saharan Africa (IDA & IBRD countries)SudanSurinameSwazilandSwedenSwitzerlandSyrian Arab RepublicTajikistanTanzaniaThailandTimor-LesteTogoTongaTrinidad and TobagoTunisiaTurkeyTurkmenistanUgandaUkraineUnited Arab EmiratesUnited KingdomUnited StatesUpper middle incomeUruguayUzbekistanVanuatuVenezuela, RBVietnamWorldYemen, Rep.ZambiaZimbabwe Timeline:
This timeline shows a graph from 1971 to 2016 of IDA & IBRD total. No data until 1970. Number of actual observations by date: 46.
Source name:
World Development Indicators
Source organization:
Estimates based on sources and methods described in "The Changing Wealth of Nations: Measuring Sustainable Development in the New Millennium" (World Bank, 2011).
Categories, topics:
Energy & Mining, Environment
Last updated:
apr 23, 2017
Indicators value changes by year
Maximum:
15.839
jan 1, 1980
At the date of observation
Value
Absolute change
Change from previous value
jan 1, 1971
1.744
+1.744
0.0%
jan 1, 1972
1.58
-0.163
-9.37%
jan 1, 1973
1.77
+0.189
11.99%
jan 1, 1974
2.734
+0.964
54.48%
jan 1, 1975
8.407
+5.673
207.52%
jan 1, 1976
7.813
-0.594
-7.06%
jan 1, 1977
8.598
+0.785
10.05%
jan 1, 1978
8.919
+0.32
3.72%
jan 1, 1979
8.366
-0.553
-6.2%
jan 1, 1980
15.839
+7.474
89.34%
jan 1, 1981
14.489
-1.35
-8.52%
jan 1, 1982
10.142
-4.347
-30.0%
jan 1, 1983
8.244
-1.899
-18.72%
jan 1, 1984
8.27
+0.026
0.31%
jan 1, 1985
7.787
-0.482
-5.83%
jan 1, 1986
7.641
-0.146
-1.87%
jan 1, 1987
4.156
-3.485
-45.61%
jan 1, 1988
5.599
+1.443
34.71%
jan 1, 1989
5.212
-0.387
-6.92%
jan 1, 1990
7.594
+2.382
45.71%
jan 1, 1991
8.827
+1.233
16.24%
jan 1, 1992
5.17
-3.657
-41.43%
jan 1, 1993
4.919
-0.251
-4.85%
jan 1, 1994
4.548
-0.372
-7.55%
jan 1, 1995
4.016
-0.532
-11.7%
jan 1, 1996
4.22
+0.204
5.08%
jan 1, 1997
4.563
+0.343
8.13%
jan 1, 1998
3.903
-0.66
-14.47%
jan 1, 1999
2.404
-1.499
-38.4%
jan 1, 2000
3.307
+0.903
37.55%
jan 1, 2001
5.607
+2.299
69.53%
jan 1, 2002
4.988
-0.618
-11.03%
jan 1, 2003
4.827
-0.162
-3.24%
jan 1, 2004
5.377
+0.551
11.41%
jan 1, 2005
7.139
+1.762
32.76%
jan 1, 2006
8.658
+1.519
21.27%
jan 1, 2007
9.404
+0.747
8.63%
jan 1, 2008
9.155
-0.249
-2.65%
jan 1, 2009
11.294
+2.139
23.37%
jan 1, 2010
6.134
-5.16
-45.69%
jan 1, 2011
7.665
+1.531
24.97%
jan 1, 2012
9.414
+1.749
22.82%
jan 1, 2013
7.788
-1.626
-17.27%
jan 1, 2014
6.811
-0.976
-12.54%
jan 1, 2015
5.651
-1.161
-17.04%
jan 1, 2016
3.013
-2.638
-46.68%
Ranking of countries by current statistics by years


Comments: