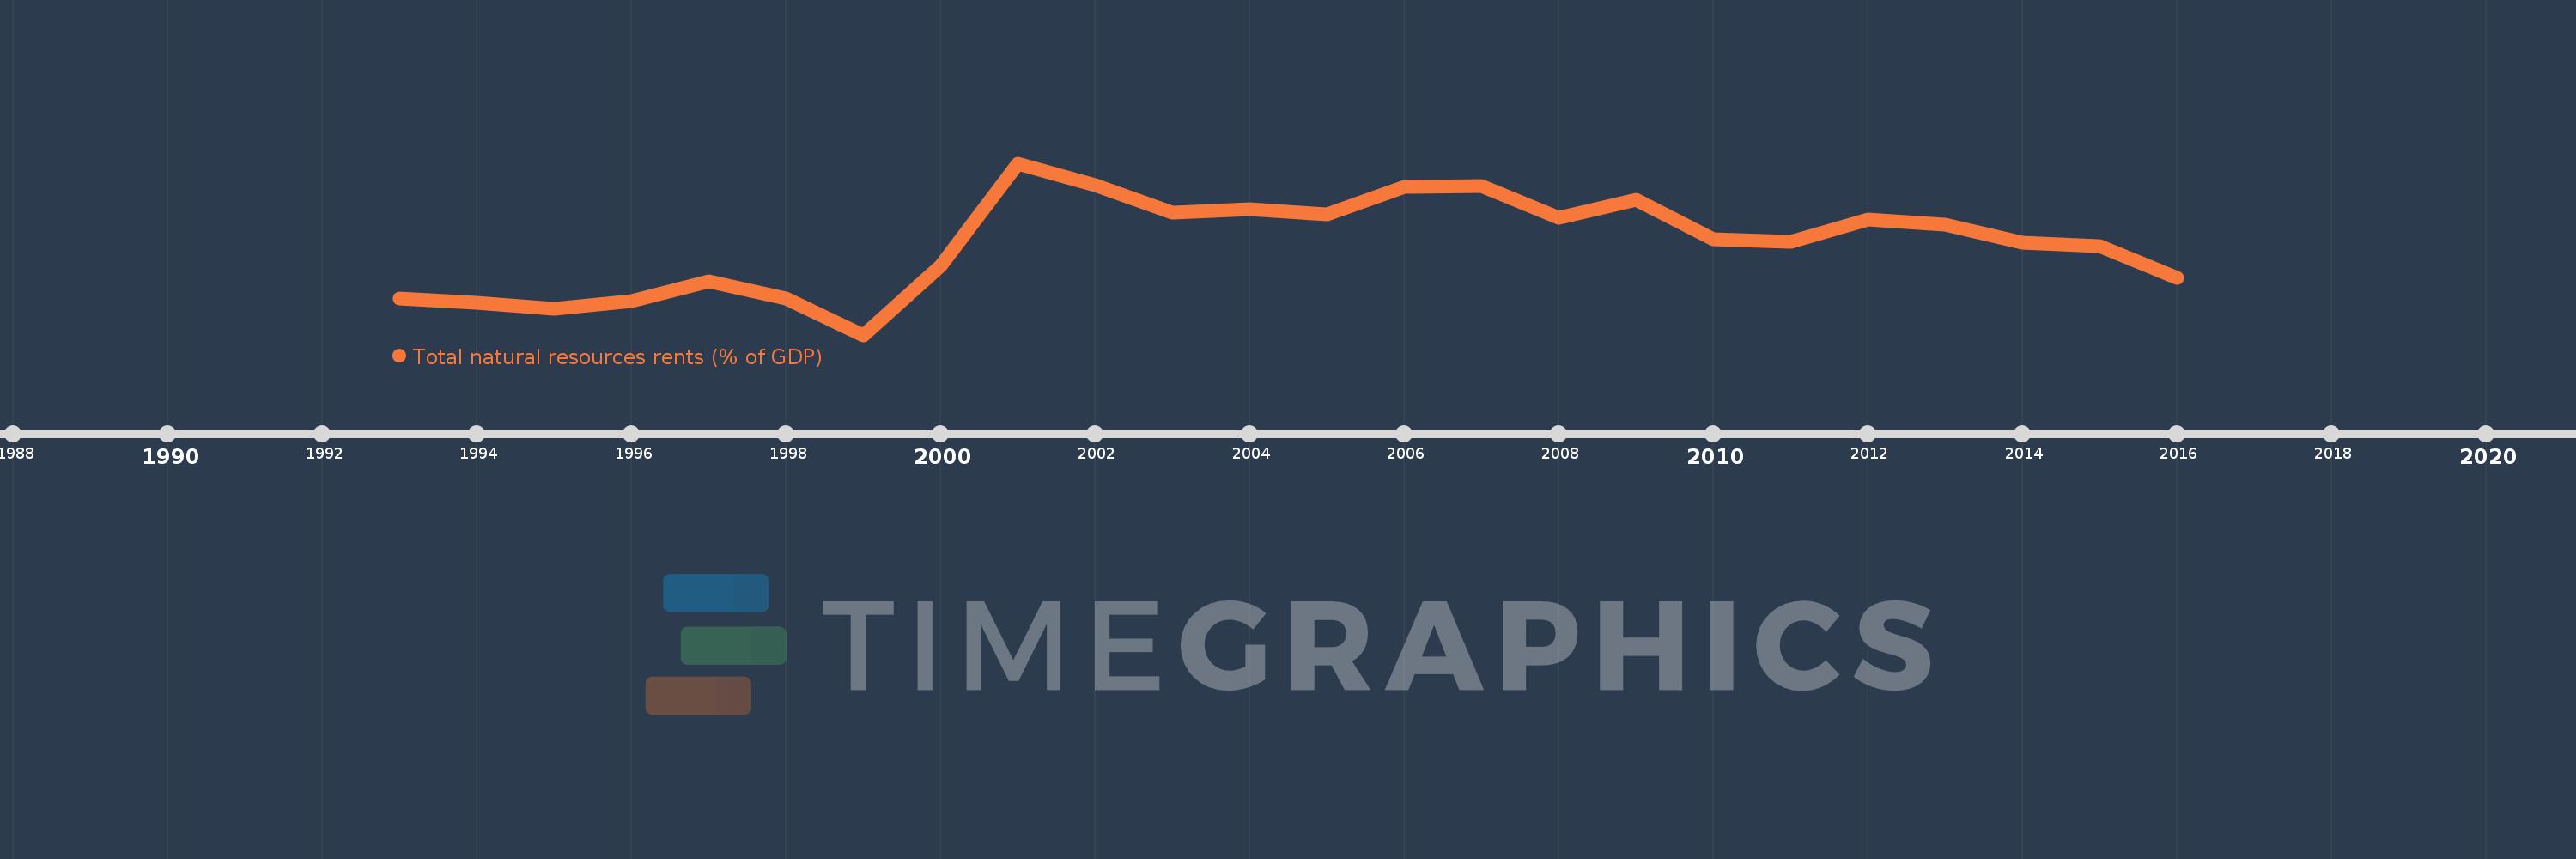
This timeline shows a graph from 1993 to 2016 of Russian Federation. No data until 1992. Number of actual observations by date: 24.
Source name:
World Development Indicators
Source organization:
Estimates based on sources and methods described in "The Changing Wealth of Nations: Measuring Sustainable Development in the New Millennium" (World Bank, 2011).
Categories, topics:
Energy & Mining, Environment
Last updated:
apr 23, 2017
Indicators value changes by year
Meaning:
13.66
Minimum:
4.561
jan 1, 1999
Maximum:
21.752
jan 1, 2001
At the date of observation
Value
Absolute change
Change from the previous value
jan 1, 1993
8.192
+8.192
0.0%
jan 1, 1994
7.793
-0.4
-4.88%
jan 1, 1995
7.168
-0.625
-8.02%
jan 1, 1996
7.956
+0.788
11.0%
jan 1, 1997
9.899
+1.943
24.42%
jan 1, 1998
8.251
-1.648
-16.65%
jan 1, 1999
4.561
-3.69
-44.72%
jan 1, 2000
11.514
+6.953
152.45%
jan 1, 2001
21.752
+10.238
88.92%
jan 1, 2002
19.55
-2.202
-10.12%
jan 1, 2003
16.841
-2.709
-13.86%
jan 1, 2004
17.114
+0.273
1.62%
jan 1, 2005
16.645
-0.468
-2.74%
jan 1, 2006
19.401
+2.755
16.55%
jan 1, 2007
19.463
+0.063
0.32%
jan 1, 2008
16.332
-3.131
-16.09%
jan 1, 2009
18.082
+1.75
10.72%
jan 1, 2010
14.166
-3.916
-21.66%
jan 1, 2011
13.901
-0.265
-1.87%
jan 1, 2012
16.163
+2.262
16.27%
jan 1, 2013
15.585
-0.577
-3.57%
jan 1, 2014
13.763
-1.822
-11.69%
jan 1, 2015
13.467
-0.297
-2.16%
jan 1, 2016
10.28
-3.187
-23.67%
Ranking of countries by current statistics by years
