29
/
en
AIzaSyAYiBZKx7MnpbEhh9jyipgxe19OcubqV5w
April 1, 2024
55223
Post-demographic dividend
PST
false
2
1
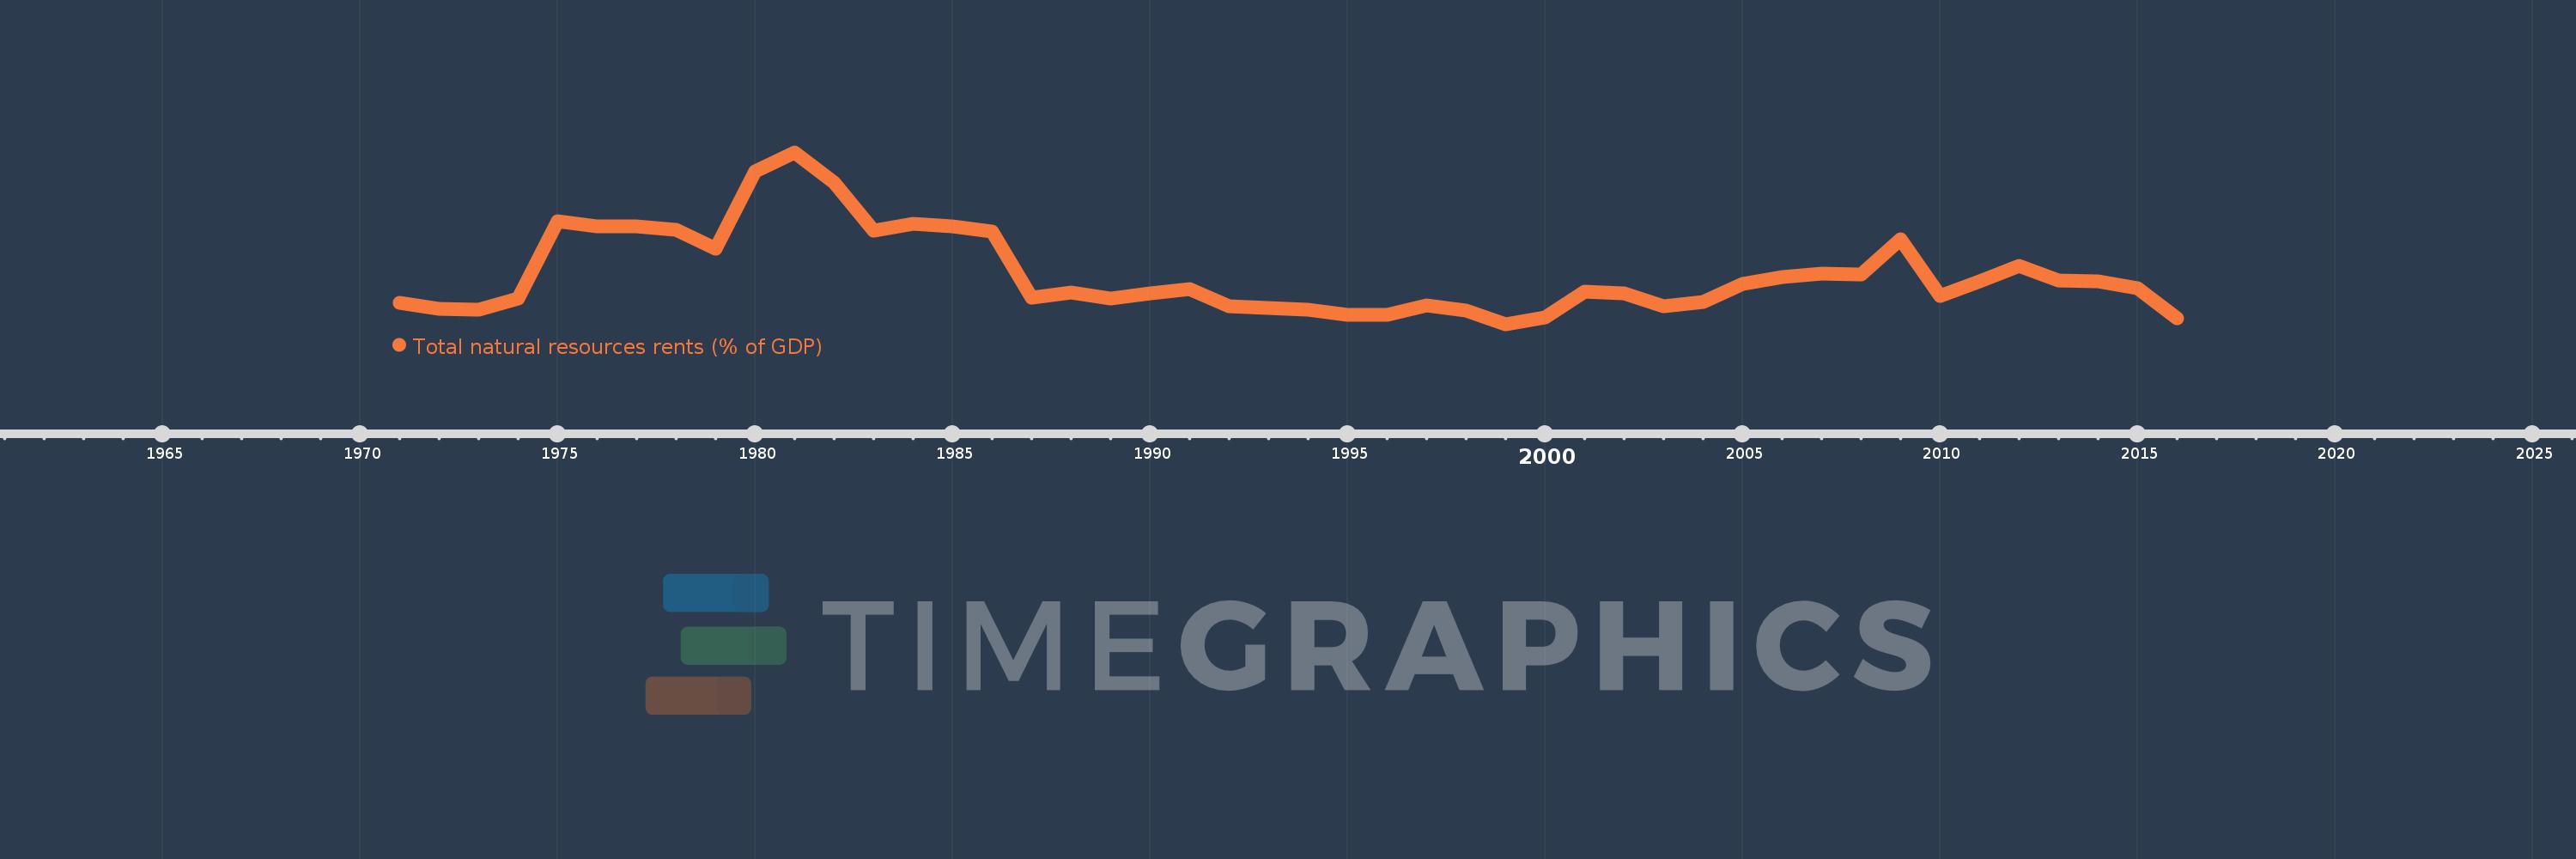
Total natural resources rents (% of GDP)
2016,2015,2014,2013,2012,2011,2010,2009,2008,2007,2006,2005,2004,2003,2002,2001,2000,1999,1998,1997,1996,1995,1994,1993,1992,1991,1990,1989,1988,1987,1986,1985,1984,1983,1982,1981,1980,1979,1978,1977,1976,1975,1974,1973,1972,1971
This statistics in other country:
AfghanistanAlbaniaAlgeriaAngolaArab WorldArgentinaArmeniaArubaAustraliaAustriaAzerbaijanBahamas, TheBahrainBangladeshBarbadosBelarusBelgiumBelizeBeninBhutanBoliviaBosnia and HerzegovinaBotswanaBrazilBrunei DarussalamBulgariaBurkina FasoBurundiCabo VerdeCambodiaCameroonCanadaCaribbean small statesCentral African RepublicCentral Europe and the BalticsChadChileChinaColombiaComorosCongo, Dem. Rep.Congo, Rep.Costa RicaCote d'IvoireCroatiaCubaCyprusCzech RepublicDenmarkDjiboutiDominicaDominican RepublicEarly-demographic dividendEast Asia & PacificEast Asia & Pacific (excluding high income)East Asia & Pacific (IDA & IBRD countries)EcuadorEgypt, Arab Rep.El SalvadorEquatorial GuineaEritreaEstoniaEthiopiaEuro areaEurope & Central AsiaEurope & Central Asia (excluding high income)Europe & Central Asia (IDA & IBRD countries)European UnionFijiFinlandFragile and conflict affected situationsFranceFrench PolynesiaGabonGambia, TheGeorgiaGermanyGhanaGreeceGuatemalaGuineaGuinea-BissauGuyanaHaitiHeavily indebted poor countries (HIPC)High incomeHondurasHong Kong SAR, ChinaHungaryIBRD onlyIcelandIDA & IBRD totalIDA blendIDA onlyIDA totalIndiaIndonesiaIran, Islamic Rep.IraqIrelandIsraelItalyJamaicaJapanJordanKazakhstanKenyaKiribatiKorea, Rep.KuwaitKyrgyz RepublicLao PDRLate-demographic dividendLatin America & Caribbean Latin America & Caribbean (excluding high income)Latin America & the Caribbean (IDA & IBRD countries)LatviaLeast developed countries: UN classificationLebanonLesothoLiberiaLibyaLithuaniaLow & middle incomeLow incomeLower middle incomeLuxembourgMacao SAR, ChinaMacedonia, FYRMadagascarMalawiMalaysiaMaldivesMaliMaltaMauritaniaMauritiusMexicoMiddle East & North AfricaMiddle East & North Africa (excluding high income)Middle East & North Africa (IDA & IBRD countries)Middle incomeMoldovaMongoliaMontenegroMoroccoMozambiqueMyanmarNamibiaNepalNetherlandsNew CaledoniaNew ZealandNicaraguaNigerNigeriaNorth AmericaNorwayOECD membersOmanOther small statesPacific island small statesPakistanPanamaPapua New GuineaParaguayPeruPhilippinesPolandPortugalPost-demographic dividendPre-demographic dividendQatarRomaniaRussian FederationRwandaSamoaSao Tome and PrincipeSaudi ArabiaSenegalSerbiaSeychellesSierra LeoneSingaporeSlovak RepublicSloveniaSmall statesSolomon IslandsSouth AfricaSouth AsiaSouth Asia (IDA & IBRD)South SudanSpainSri LankaSt. LuciaSt. Vincent and the GrenadinesSub-Saharan Africa Sub-Saharan Africa (excluding high income)Sub-Saharan Africa (IDA & IBRD countries)SudanSurinameSwazilandSwedenSwitzerlandSyrian Arab RepublicTajikistanTanzaniaThailandTimor-LesteTogoTongaTrinidad and TobagoTunisiaTurkeyTurkmenistanUgandaUkraineUnited Arab EmiratesUnited KingdomUnited StatesUpper middle incomeUruguayUzbekistanVanuatuVenezuela, RBVietnamWorldYemen, Rep.ZambiaZimbabwe Timeline:
This timeline shows a graph from 1971 to 2016 of Post-demographic dividend. No data until 1970. Number of actual observations by date: 46.
Source name:
World Development Indicators
Source organization:
Estimates based on sources and methods described in "The Changing Wealth of Nations: Measuring Sustainable Development in the New Millennium" (World Bank, 2011).
Categories, topics:
Energy & Mining, Environment
Last updated:
apr 23, 2017
Indicators value changes by year
At the date of observation
Value
Absolute change
Change from previous value
jan 1, 1971
0.64
+0.64
0.0%
jan 1, 1972
0.554
-0.086
-13.45%
jan 1, 1973
0.538
-0.015
-2.75%
jan 1, 1974
0.71
+0.171
31.81%
jan 1, 1975
1.825
+1.115
157.15%
jan 1, 1976
1.751
-0.073
-4.02%
jan 1, 1977
1.759
+0.008
0.45%
jan 1, 1978
1.711
-0.048
-2.73%
jan 1, 1979
1.436
-0.276
-16.11%
jan 1, 1980
2.554
+1.118
77.91%
jan 1, 1981
2.833
+0.279
10.94%
jan 1, 1982
2.393
-0.44
-15.53%
jan 1, 1983
1.694
-0.699
-29.22%
jan 1, 1984
1.793
+0.099
5.86%
jan 1, 1985
1.751
-0.042
-2.34%
jan 1, 1986
1.675
-0.077
-4.38%
jan 1, 1987
0.72
-0.954
-56.99%
jan 1, 1988
0.798
+0.078
10.77%
jan 1, 1989
0.705
-0.093
-11.66%
jan 1, 1990
0.782
+0.077
10.89%
jan 1, 1991
0.843
+0.061
7.84%
jan 1, 1992
0.591
-0.252
-29.85%
jan 1, 1993
0.569
-0.023
-3.84%
jan 1, 1994
0.547
-0.022
-3.8%
jan 1, 1995
0.468
-0.079
-14.39%
jan 1, 1996
0.47
+0.002
0.41%
jan 1, 1997
0.605
+0.135
28.78%
jan 1, 1998
0.533
-0.072
-11.96%
jan 1, 1999
0.331
-0.202
-37.94%
jan 1, 2000
0.43
+0.099
29.89%
jan 1, 2001
0.805
+0.375
87.32%
jan 1, 2002
0.775
-0.03
-3.73%
jan 1, 2003
0.597
-0.178
-22.95%
jan 1, 2004
0.657
+0.06
10.06%
jan 1, 2005
0.916
+0.259
39.37%
jan 1, 2006
1.02
+0.104
11.31%
jan 1, 2007
1.064
+0.044
4.35%
jan 1, 2008
1.056
-0.008
-0.76%
jan 1, 2009
1.563
+0.507
47.99%
jan 1, 2010
0.742
-0.82
-52.49%
jan 1, 2011
0.96
+0.217
29.28%
jan 1, 2012
1.186
+0.226
23.54%
jan 1, 2013
0.969
-0.217
-18.31%
jan 1, 2014
0.956
-0.012
-1.26%
jan 1, 2015
0.852
-0.105
-10.95%
jan 1, 2016
0.423
-0.428
-50.29%
Ranking of countries by current statistics by years


Comments: