29
/
en
AIzaSyAYiBZKx7MnpbEhh9jyipgxe19OcubqV5w
April 1, 2024
159981
Ireland
IRL
true
2
1
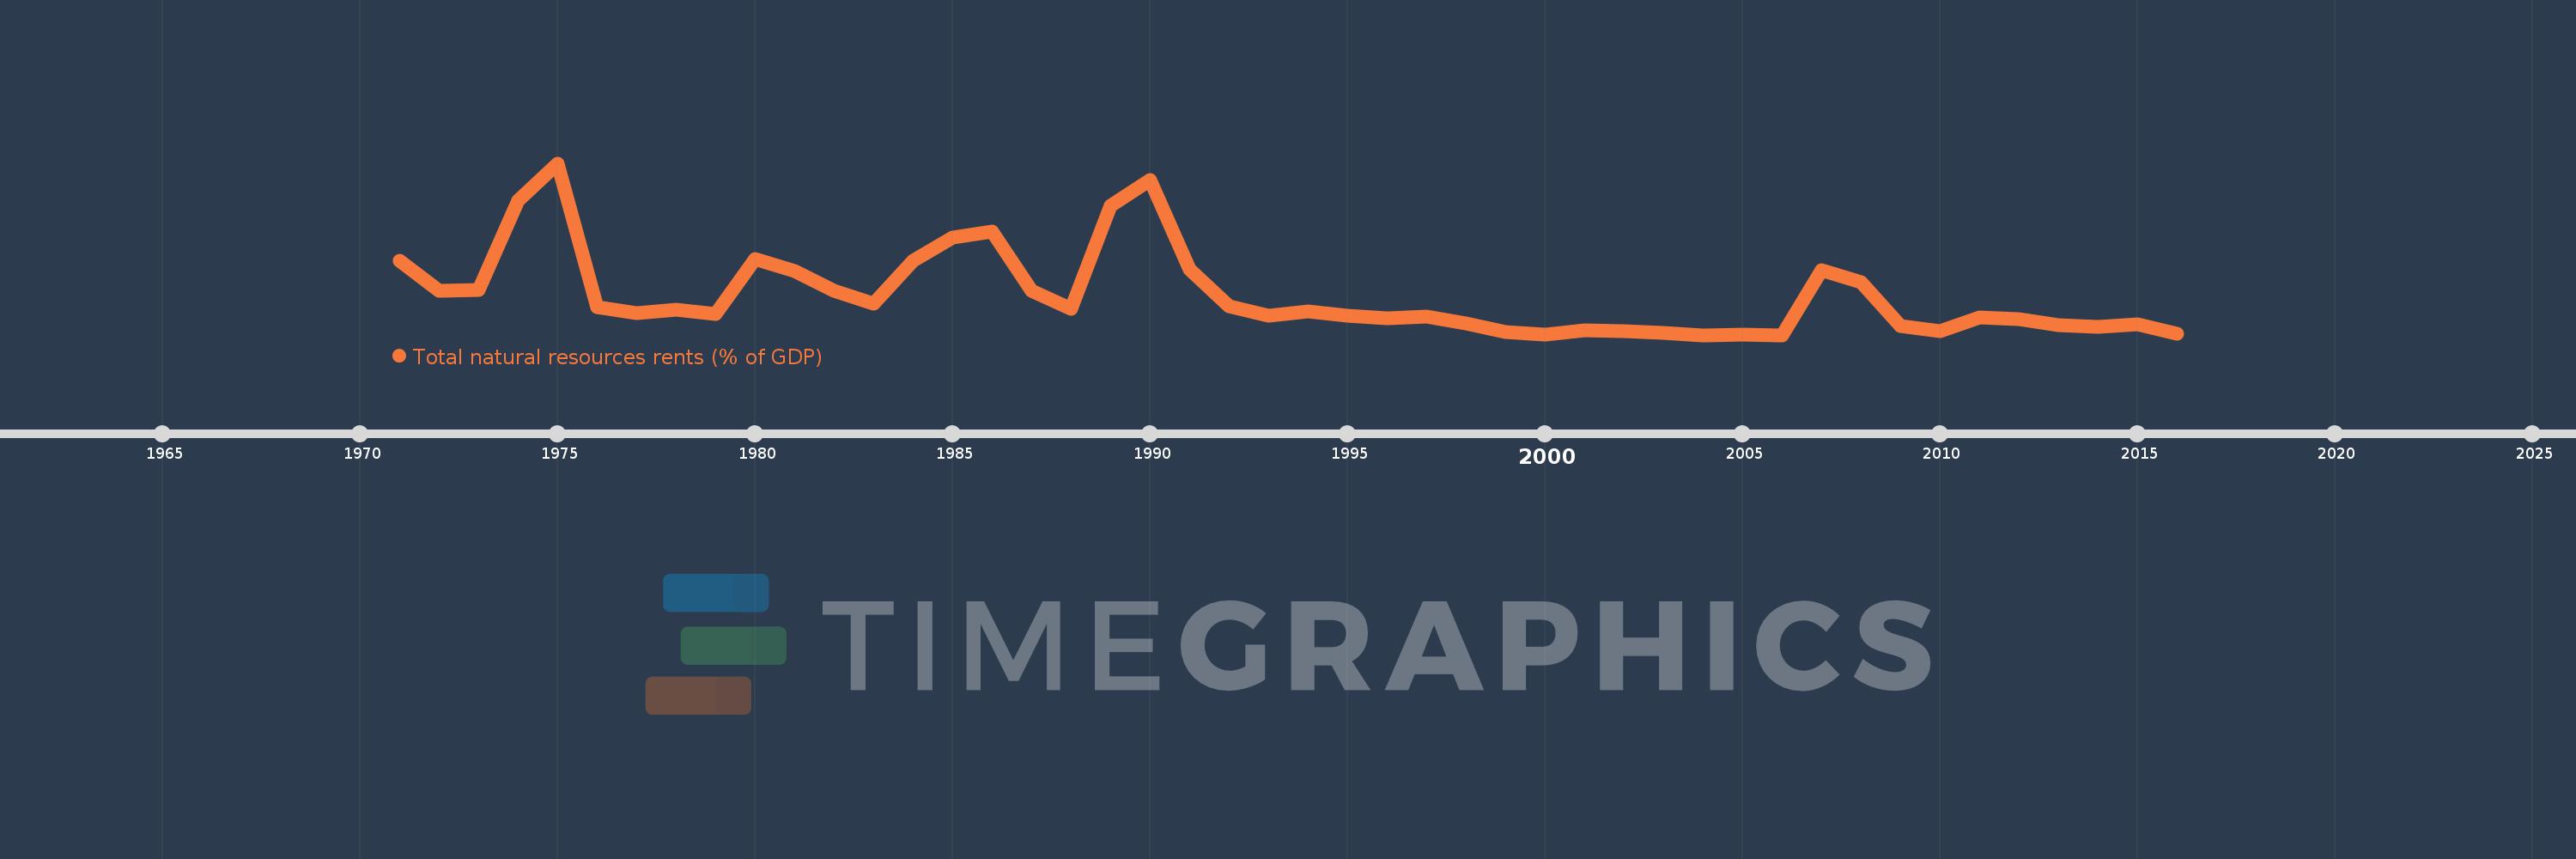
Total natural resources rents (% of GDP)
2016,2015,2014,2013,2012,2011,2010,2009,2008,2007,2006,2005,2004,2003,2002,2001,2000,1999,1998,1997,1996,1995,1994,1993,1992,1991,1990,1989,1988,1987,1986,1985,1984,1983,1982,1981,1980,1979,1978,1977,1976,1975,1974,1973,1972,1971
This statistics in other country:
AfghanistanAlbaniaAlgeriaAngolaArab WorldArgentinaArmeniaArubaAustraliaAustriaAzerbaijanBahamas, TheBahrainBangladeshBarbadosBelarusBelgiumBelizeBeninBhutanBoliviaBosnia and HerzegovinaBotswanaBrazilBrunei DarussalamBulgariaBurkina FasoBurundiCabo VerdeCambodiaCameroonCanadaCaribbean small statesCentral African RepublicCentral Europe and the BalticsChadChileChinaColombiaComorosCongo, Dem. Rep.Congo, Rep.Costa RicaCote d'IvoireCroatiaCubaCyprusCzech RepublicDenmarkDjiboutiDominicaDominican RepublicEarly-demographic dividendEast Asia & PacificEast Asia & Pacific (excluding high income)East Asia & Pacific (IDA & IBRD countries)EcuadorEgypt, Arab Rep.El SalvadorEquatorial GuineaEritreaEstoniaEthiopiaEuro areaEurope & Central AsiaEurope & Central Asia (excluding high income)Europe & Central Asia (IDA & IBRD countries)European UnionFijiFinlandFragile and conflict affected situationsFranceFrench PolynesiaGabonGambia, TheGeorgiaGermanyGhanaGreeceGuatemalaGuineaGuinea-BissauGuyanaHaitiHeavily indebted poor countries (HIPC)High incomeHondurasHong Kong SAR, ChinaHungaryIBRD onlyIcelandIDA & IBRD totalIDA blendIDA onlyIDA totalIndiaIndonesiaIran, Islamic Rep.IraqIrelandIsraelItalyJamaicaJapanJordanKazakhstanKenyaKiribatiKorea, Rep.KuwaitKyrgyz RepublicLao PDRLate-demographic dividendLatin America & Caribbean Latin America & Caribbean (excluding high income)Latin America & the Caribbean (IDA & IBRD countries)LatviaLeast developed countries: UN classificationLebanonLesothoLiberiaLibyaLithuaniaLow & middle incomeLow incomeLower middle incomeLuxembourgMacao SAR, ChinaMacedonia, FYRMadagascarMalawiMalaysiaMaldivesMaliMaltaMauritaniaMauritiusMexicoMiddle East & North AfricaMiddle East & North Africa (excluding high income)Middle East & North Africa (IDA & IBRD countries)Middle incomeMoldovaMongoliaMontenegroMoroccoMozambiqueMyanmarNamibiaNepalNetherlandsNew CaledoniaNew ZealandNicaraguaNigerNigeriaNorth AmericaNorwayOECD membersOmanOther small statesPacific island small statesPakistanPanamaPapua New GuineaParaguayPeruPhilippinesPolandPortugalPost-demographic dividendPre-demographic dividendQatarRomaniaRussian FederationRwandaSamoaSao Tome and PrincipeSaudi ArabiaSenegalSerbiaSeychellesSierra LeoneSingaporeSlovak RepublicSloveniaSmall statesSolomon IslandsSouth AfricaSouth AsiaSouth Asia (IDA & IBRD)South SudanSpainSri LankaSt. LuciaSt. Vincent and the GrenadinesSub-Saharan Africa Sub-Saharan Africa (excluding high income)Sub-Saharan Africa (IDA & IBRD countries)SudanSurinameSwazilandSwedenSwitzerlandSyrian Arab RepublicTajikistanTanzaniaThailandTimor-LesteTogoTongaTrinidad and TobagoTunisiaTurkeyTurkmenistanUgandaUkraineUnited Arab EmiratesUnited KingdomUnited StatesUpper middle incomeUruguayUzbekistanVanuatuVenezuela, RBVietnamWorldYemen, Rep.ZambiaZimbabwe Timeline:
This timeline shows a graph from 1971 to 2016 of Ireland. No data until 1970. Number of actual observations by date: 46.
Source name:
World Development Indicators
Source organization:
Estimates based on sources and methods described in "The Changing Wealth of Nations: Measuring Sustainable Development in the New Millennium" (World Bank, 2011).
Categories, topics:
Energy & Mining, Environment
Last updated:
apr 23, 2017
Indicators value changes by year
At the date of observation
Value
Absolute change
Change from previous value
jan 1, 1971
0.427
+0.427
0.0%
jan 1, 1972
0.271
-0.157
-36.65%
jan 1, 1973
0.276
+0.005
1.98%
jan 1, 1974
0.742
+0.466
168.74%
jan 1, 1975
0.94
+0.198
26.64%
jan 1, 1976
0.185
-0.755
-80.3%
jan 1, 1977
0.155
-0.031
-16.5%
jan 1, 1978
0.169
+0.015
9.61%
jan 1, 1979
0.149
-0.021
-12.11%
jan 1, 1980
0.437
+0.288
193.68%
jan 1, 1981
0.376
-0.061
-13.9%
jan 1, 1982
0.269
-0.107
-28.49%
jan 1, 1983
0.204
-0.066
-24.35%
jan 1, 1984
0.429
+0.225
110.71%
jan 1, 1985
0.548
+0.119
27.69%
jan 1, 1986
0.58
+0.032
5.92%
jan 1, 1987
0.27
-0.31
-53.43%
jan 1, 1988
0.177
-0.094
-34.64%
jan 1, 1989
0.719
+0.542
306.89%
jan 1, 1990
0.852
+0.133
18.55%
jan 1, 1991
0.382
-0.47
-55.17%
jan 1, 1992
0.19
-0.192
-50.14%
jan 1, 1993
0.14
-0.051
-26.53%
jan 1, 1994
0.16
+0.02
14.14%
jan 1, 1995
0.14
-0.02
-12.44%
jan 1, 1996
0.124
-0.016
-11.14%
jan 1, 1997
0.136
+0.012
9.54%
jan 1, 1998
0.1
-0.036
-26.18%
jan 1, 1999
0.054
-0.047
-46.72%
jan 1, 2000
0.041
-0.013
-23.76%
jan 1, 2001
0.061
+0.021
50.44%
jan 1, 2002
0.06
-0.001
-2.0%
jan 1, 2003
0.05
-0.01
-16.59%
jan 1, 2004
0.038
-0.013
-25.09%
jan 1, 2005
0.041
+0.003
7.83%
jan 1, 2006
0.038
-0.002
-5.98%
jan 1, 2007
0.38
+0.342
898.11%
jan 1, 2008
0.314
-0.066
-17.39%
jan 1, 2009
0.085
-0.229
-72.9%
jan 1, 2010
0.06
-0.025
-28.98%
jan 1, 2011
0.132
+0.072
118.93%
jan 1, 2012
0.122
-0.01
-7.83%
jan 1, 2013
0.089
-0.033
-26.84%
jan 1, 2014
0.082
-0.007
-8.12%
jan 1, 2015
0.095
+0.013
15.72%
jan 1, 2016
0.046
-0.049
-51.43%
Ranking of countries by current statistics by years


Comments: