29
/
en
AIzaSyAYiBZKx7MnpbEhh9jyipgxe19OcubqV5w
April 1, 2024
145192
Guatemala
GTM
true
2
1
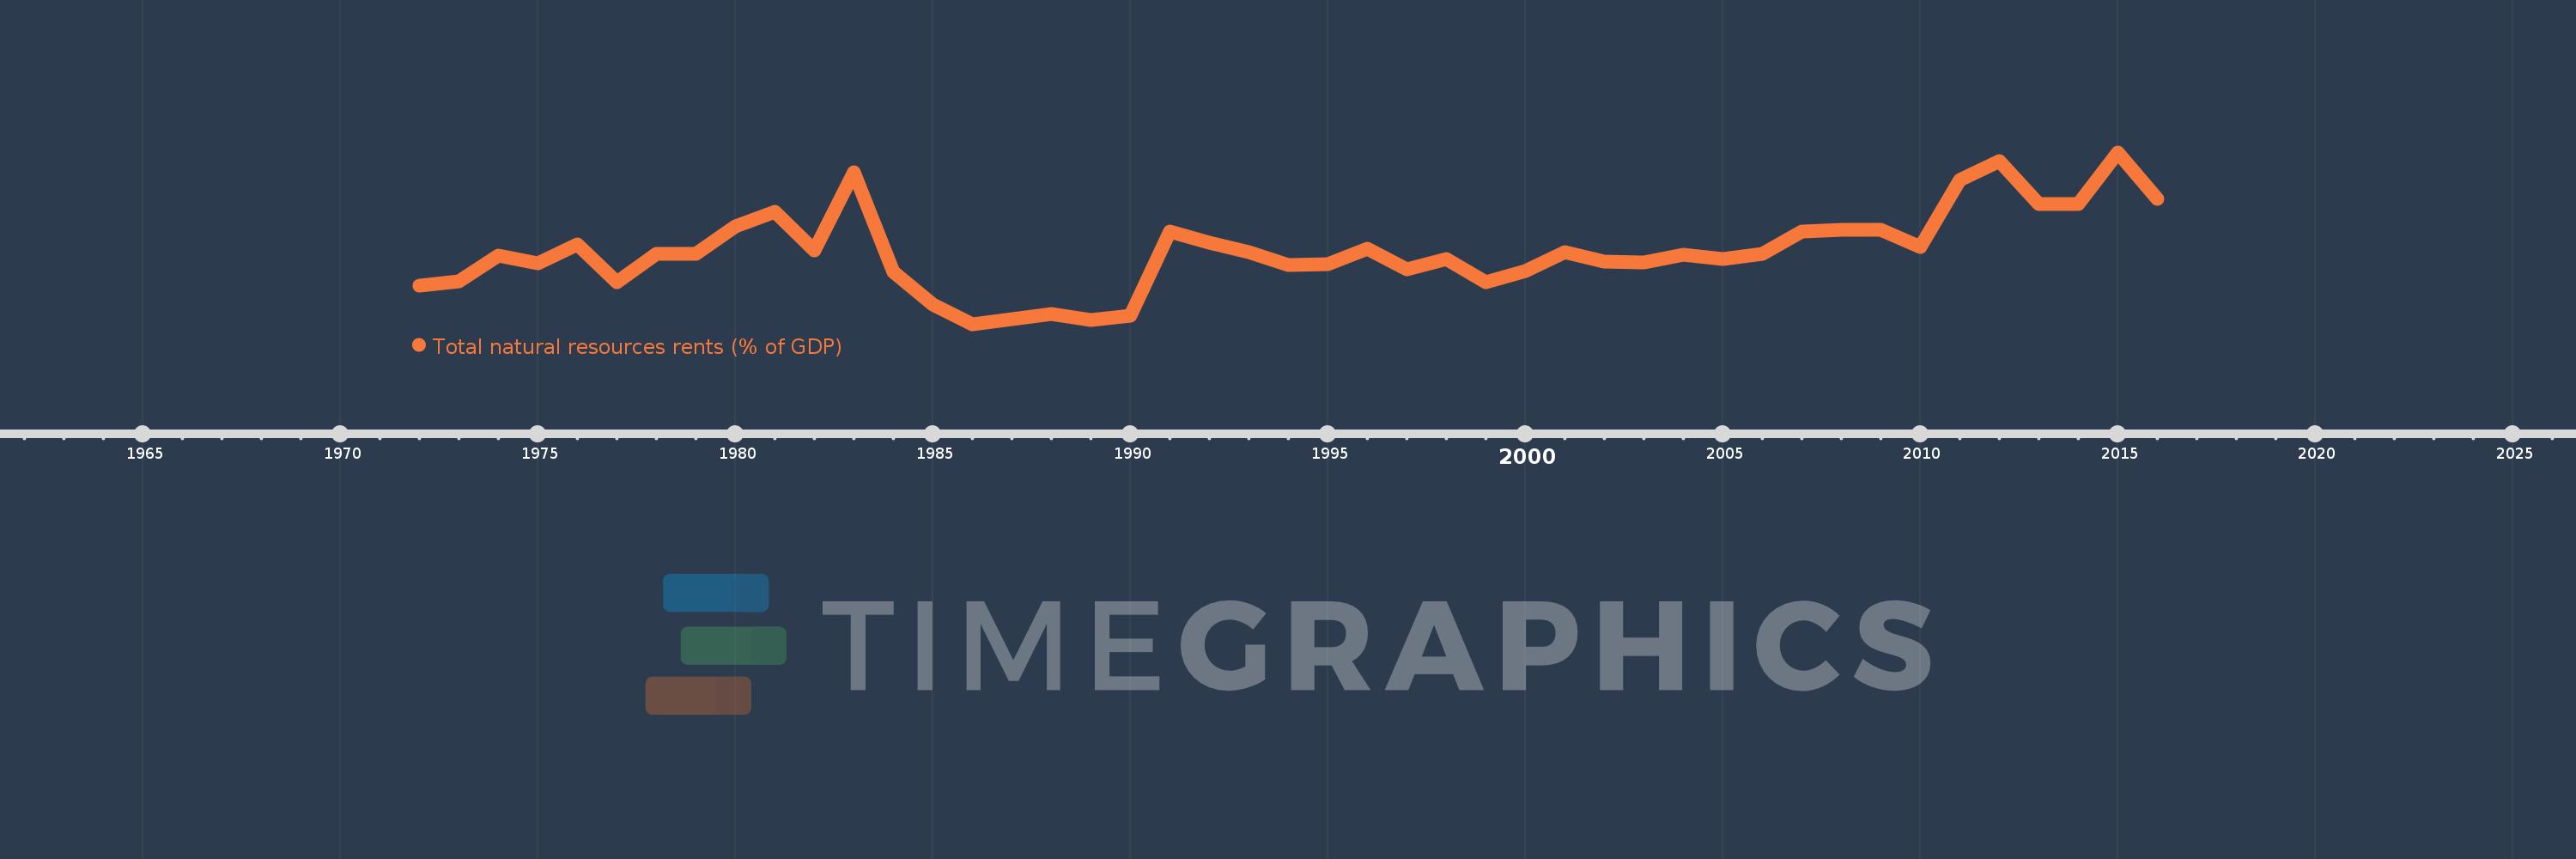
Total natural resources rents (% of GDP)
2016,2015,2014,2013,2012,2011,2010,2009,2008,2007,2006,2005,2004,2003,2002,2001,2000,1999,1998,1997,1996,1995,1994,1993,1992,1991,1990,1989,1988,1987,1986,1985,1984,1983,1982,1981,1980,1979,1978,1977,1976,1975,1974,1973,1972
This statistics in other country:
AfghanistanAlbaniaAlgeriaAngolaArab WorldArgentinaArmeniaArubaAustraliaAustriaAzerbaijanBahamas, TheBahrainBangladeshBarbadosBelarusBelgiumBelizeBeninBhutanBoliviaBosnia and HerzegovinaBotswanaBrazilBrunei DarussalamBulgariaBurkina FasoBurundiCabo VerdeCambodiaCameroonCanadaCaribbean small statesCentral African RepublicCentral Europe and the BalticsChadChileChinaColombiaComorosCongo, Dem. Rep.Congo, Rep.Costa RicaCote d'IvoireCroatiaCubaCyprusCzech RepublicDenmarkDjiboutiDominicaDominican RepublicEarly-demographic dividendEast Asia & PacificEast Asia & Pacific (excluding high income)East Asia & Pacific (IDA & IBRD countries)EcuadorEgypt, Arab Rep.El SalvadorEquatorial GuineaEritreaEstoniaEthiopiaEuro areaEurope & Central AsiaEurope & Central Asia (excluding high income)Europe & Central Asia (IDA & IBRD countries)European UnionFijiFinlandFragile and conflict affected situationsFranceFrench PolynesiaGabonGambia, TheGeorgiaGermanyGhanaGreeceGuatemalaGuineaGuinea-BissauGuyanaHaitiHeavily indebted poor countries (HIPC)High incomeHondurasHong Kong SAR, ChinaHungaryIBRD onlyIcelandIDA & IBRD totalIDA blendIDA onlyIDA totalIndiaIndonesiaIran, Islamic Rep.IraqIrelandIsraelItalyJamaicaJapanJordanKazakhstanKenyaKiribatiKorea, Rep.KuwaitKyrgyz RepublicLao PDRLate-demographic dividendLatin America & Caribbean Latin America & Caribbean (excluding high income)Latin America & the Caribbean (IDA & IBRD countries)LatviaLeast developed countries: UN classificationLebanonLesothoLiberiaLibyaLithuaniaLow & middle incomeLow incomeLower middle incomeLuxembourgMacao SAR, ChinaMacedonia, FYRMadagascarMalawiMalaysiaMaldivesMaliMaltaMauritaniaMauritiusMexicoMiddle East & North AfricaMiddle East & North Africa (excluding high income)Middle East & North Africa (IDA & IBRD countries)Middle incomeMoldovaMongoliaMontenegroMoroccoMozambiqueMyanmarNamibiaNepalNetherlandsNew CaledoniaNew ZealandNicaraguaNigerNigeriaNorth AmericaNorwayOECD membersOmanOther small statesPacific island small statesPakistanPanamaPapua New GuineaParaguayPeruPhilippinesPolandPortugalPost-demographic dividendPre-demographic dividendQatarRomaniaRussian FederationRwandaSamoaSao Tome and PrincipeSaudi ArabiaSenegalSerbiaSeychellesSierra LeoneSingaporeSlovak RepublicSloveniaSmall statesSolomon IslandsSouth AfricaSouth AsiaSouth Asia (IDA & IBRD)South SudanSpainSri LankaSt. LuciaSt. Vincent and the GrenadinesSub-Saharan Africa Sub-Saharan Africa (excluding high income)Sub-Saharan Africa (IDA & IBRD countries)SudanSurinameSwazilandSwedenSwitzerlandSyrian Arab RepublicTajikistanTanzaniaThailandTimor-LesteTogoTongaTrinidad and TobagoTunisiaTurkeyTurkmenistanUgandaUkraineUnited Arab EmiratesUnited KingdomUnited StatesUpper middle incomeUruguayUzbekistanVanuatuVenezuela, RBVietnamWorldYemen, Rep.ZambiaZimbabwe Timeline:
This timeline shows a graph from 1972 to 2016 of Guatemala. No data until 1971. Number of actual observations by date: 45.
Source name:
World Development Indicators
Source organization:
Estimates based on sources and methods described in "The Changing Wealth of Nations: Measuring Sustainable Development in the New Millennium" (World Bank, 2011).
Categories, topics:
Energy & Mining, Environment
Last updated:
apr 23, 2017
Indicators value changes by year
At the date of observation
Value
Absolute change
Change from previous value
jan 1, 1972
1.025
+1.025
0.0%
jan 1, 1973
1.096
+0.071
6.94%
jan 1, 1974
1.466
+0.37
33.77%
jan 1, 1975
1.347
-0.119
-8.12%
jan 1, 1976
1.622
+0.275
20.41%
jan 1, 1977
1.078
-0.544
-33.54%
jan 1, 1978
1.486
+0.408
37.87%
jan 1, 1979
1.49
+0.004
0.25%
jan 1, 1980
1.886
+0.396
26.59%
jan 1, 1981
2.104
+0.217
11.53%
jan 1, 1982
1.538
-0.566
-26.92%
jan 1, 1983
2.683
+1.146
74.52%
jan 1, 1984
1.233
-1.45
-54.04%
jan 1, 1985
0.747
-0.486
-39.39%
jan 1, 1986
0.466
-0.281
-37.66%
jan 1, 1987
0.534
+0.068
14.63%
jan 1, 1988
0.612
+0.078
14.65%
jan 1, 1989
0.532
-0.08
-13.09%
jan 1, 1990
0.594
+0.062
11.6%
jan 1, 1991
1.816
+1.222
205.63%
jan 1, 1992
1.655
-0.16
-8.82%
jan 1, 1993
1.51
-0.145
-8.78%
jan 1, 1994
1.322
-0.189
-12.48%
jan 1, 1995
1.345
+0.024
1.81%
jan 1, 1996
1.563
+0.217
16.15%
jan 1, 1997
1.269
-0.294
-18.78%
jan 1, 1998
1.409
+0.139
10.97%
jan 1, 1999
1.076
-0.332
-23.59%
jan 1, 2000
1.235
+0.159
14.77%
jan 1, 2001
1.521
+0.286
23.16%
jan 1, 2002
1.377
-0.144
-9.47%
jan 1, 2003
1.367
-0.01
-0.74%
jan 1, 2004
1.479
+0.112
8.22%
jan 1, 2005
1.413
-0.067
-4.5%
jan 1, 2006
1.495
+0.082
5.84%
jan 1, 2007
1.818
+0.322
21.55%
jan 1, 2008
1.845
+0.027
1.49%
jan 1, 2009
1.842
-0.003
-0.14%
jan 1, 2010
1.592
-0.25
-13.57%
jan 1, 2011
2.568
+0.976
61.27%
jan 1, 2012
2.843
+0.275
10.72%
jan 1, 2013
2.21
-0.634
-22.29%
jan 1, 2014
2.215
+0.006
0.25%
jan 1, 2015
2.967
+0.752
33.95%
jan 1, 2016
2.292
-0.675
-22.75%
Ranking of countries by current statistics by years


Comments: