29
/
en
AIzaSyAYiBZKx7MnpbEhh9jyipgxe19OcubqV5w
April 1, 2024
43084
Latin America & Caribbean (excluding high income)
LAC
false
2
1
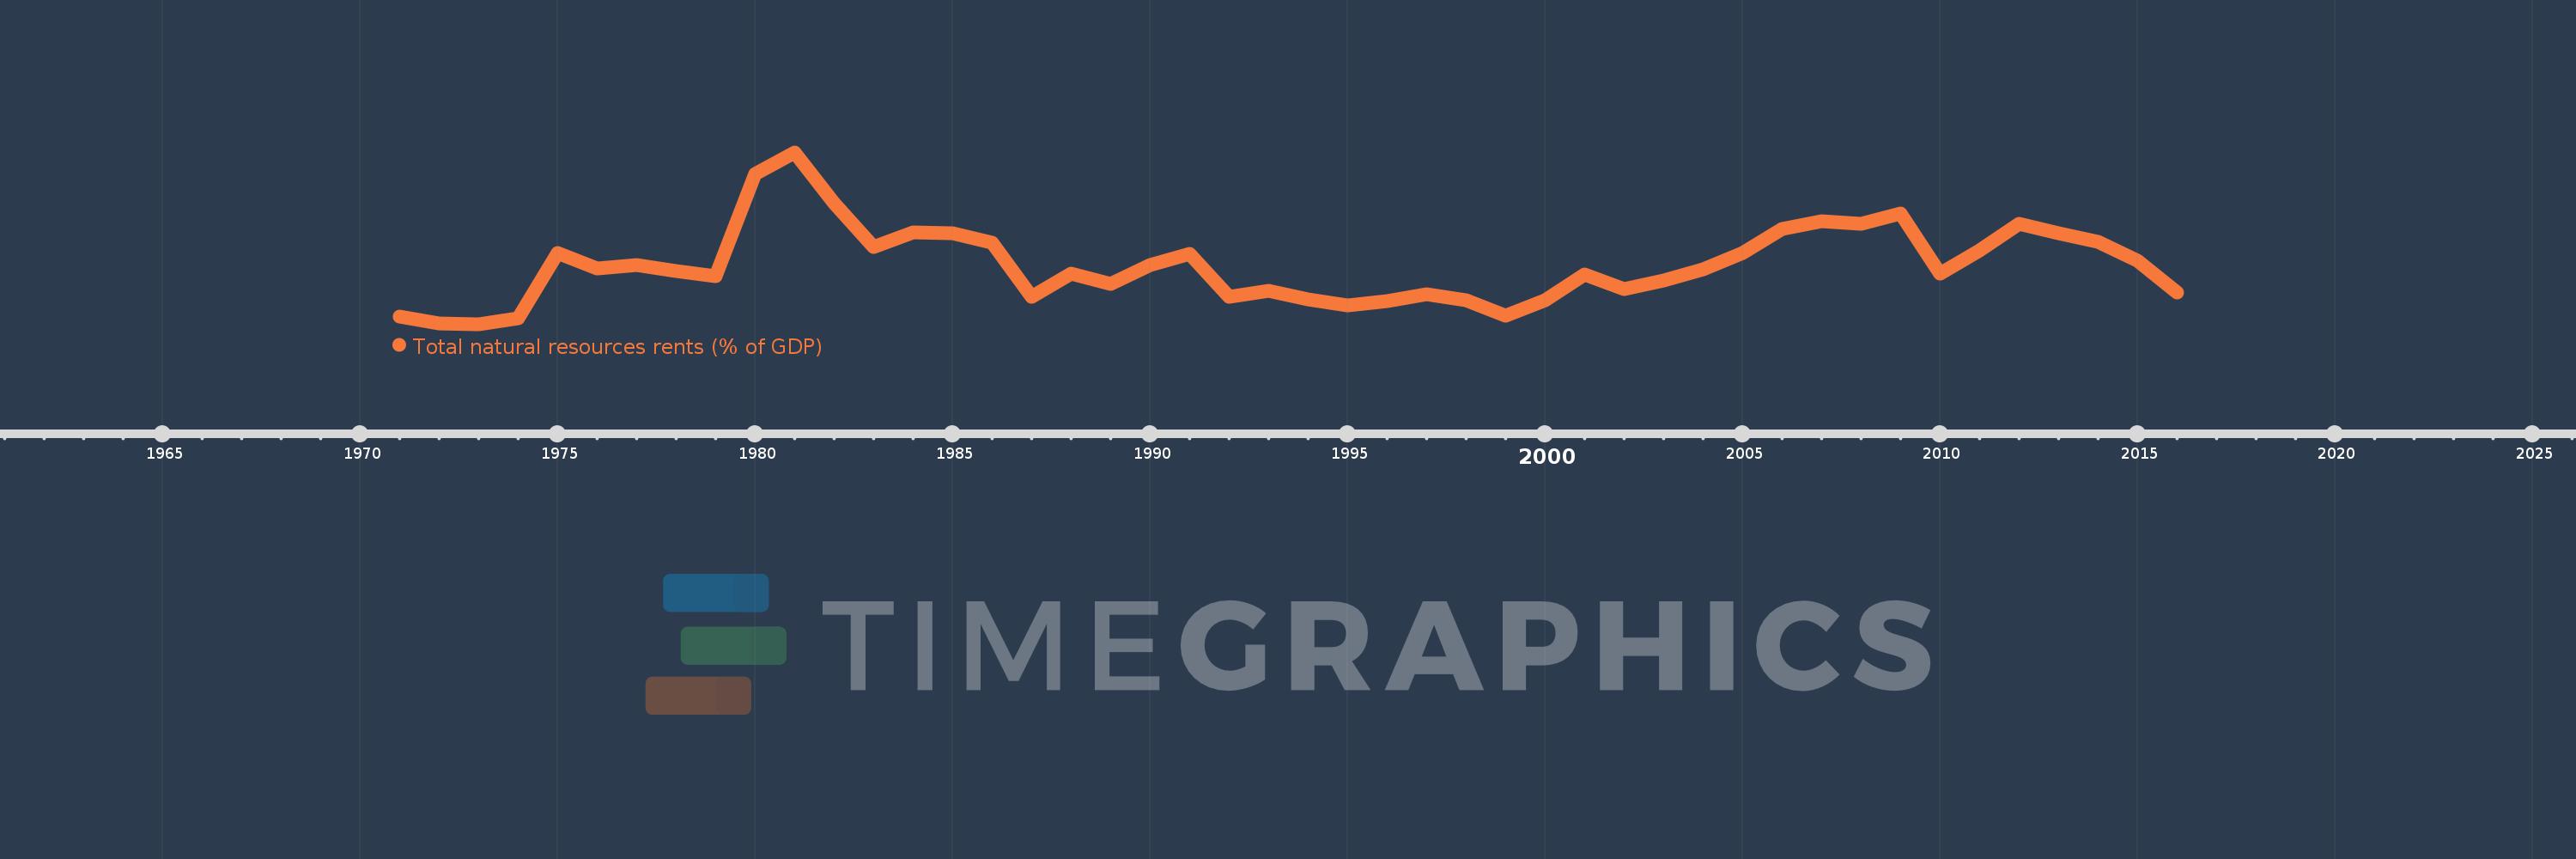
Total natural resources rents (% of GDP)
2016,2015,2014,2013,2012,2011,2010,2009,2008,2007,2006,2005,2004,2003,2002,2001,2000,1999,1998,1997,1996,1995,1994,1993,1992,1991,1990,1989,1988,1987,1986,1985,1984,1983,1982,1981,1980,1979,1978,1977,1976,1975,1974,1973,1972,1971
This statistics in other country:
AfghanistanAlbaniaAlgeriaAngolaArab WorldArgentinaArmeniaArubaAustraliaAustriaAzerbaijanBahamas, TheBahrainBangladeshBarbadosBelarusBelgiumBelizeBeninBhutanBoliviaBosnia and HerzegovinaBotswanaBrazilBrunei DarussalamBulgariaBurkina FasoBurundiCabo VerdeCambodiaCameroonCanadaCaribbean small statesCentral African RepublicCentral Europe and the BalticsChadChileChinaColombiaComorosCongo, Dem. Rep.Congo, Rep.Costa RicaCote d'IvoireCroatiaCubaCyprusCzech RepublicDenmarkDjiboutiDominicaDominican RepublicEarly-demographic dividendEast Asia & PacificEast Asia & Pacific (excluding high income)East Asia & Pacific (IDA & IBRD countries)EcuadorEgypt, Arab Rep.El SalvadorEquatorial GuineaEritreaEstoniaEthiopiaEuro areaEurope & Central AsiaEurope & Central Asia (excluding high income)Europe & Central Asia (IDA & IBRD countries)European UnionFijiFinlandFragile and conflict affected situationsFranceFrench PolynesiaGabonGambia, TheGeorgiaGermanyGhanaGreeceGuatemalaGuineaGuinea-BissauGuyanaHaitiHeavily indebted poor countries (HIPC)High incomeHondurasHong Kong SAR, ChinaHungaryIBRD onlyIcelandIDA & IBRD totalIDA blendIDA onlyIDA totalIndiaIndonesiaIran, Islamic Rep.IraqIrelandIsraelItalyJamaicaJapanJordanKazakhstanKenyaKiribatiKorea, Rep.KuwaitKyrgyz RepublicLao PDRLate-demographic dividendLatin America & Caribbean Latin America & Caribbean (excluding high income)Latin America & the Caribbean (IDA & IBRD countries)LatviaLeast developed countries: UN classificationLebanonLesothoLiberiaLibyaLithuaniaLow & middle incomeLow incomeLower middle incomeLuxembourgMacao SAR, ChinaMacedonia, FYRMadagascarMalawiMalaysiaMaldivesMaliMaltaMauritaniaMauritiusMexicoMiddle East & North AfricaMiddle East & North Africa (excluding high income)Middle East & North Africa (IDA & IBRD countries)Middle incomeMoldovaMongoliaMontenegroMoroccoMozambiqueMyanmarNamibiaNepalNetherlandsNew CaledoniaNew ZealandNicaraguaNigerNigeriaNorth AmericaNorwayOECD membersOmanOther small statesPacific island small statesPakistanPanamaPapua New GuineaParaguayPeruPhilippinesPolandPortugalPost-demographic dividendPre-demographic dividendQatarRomaniaRussian FederationRwandaSamoaSao Tome and PrincipeSaudi ArabiaSenegalSerbiaSeychellesSierra LeoneSingaporeSlovak RepublicSloveniaSmall statesSolomon IslandsSouth AfricaSouth AsiaSouth Asia (IDA & IBRD)South SudanSpainSri LankaSt. LuciaSt. Vincent and the GrenadinesSub-Saharan Africa Sub-Saharan Africa (excluding high income)Sub-Saharan Africa (IDA & IBRD countries)SudanSurinameSwazilandSwedenSwitzerlandSyrian Arab RepublicTajikistanTanzaniaThailandTimor-LesteTogoTongaTrinidad and TobagoTunisiaTurkeyTurkmenistanUgandaUkraineUnited Arab EmiratesUnited KingdomUnited StatesUpper middle incomeUruguayUzbekistanVanuatuVenezuela, RBVietnamWorldYemen, Rep.ZambiaZimbabwe Timeline:
This timeline shows a graph from 1971 to 2016 of Latin America & Caribbean (excluding high income). No data until 1970. Number of actual observations by date: 46.
Source name:
World Development Indicators
Source organization:
Estimates based on sources and methods described in "The Changing Wealth of Nations: Measuring Sustainable Development in the New Millennium" (World Bank, 2011).
Categories, topics:
Energy & Mining, Environment
Last updated:
apr 23, 2017
Indicators value changes by year
Maximum:
10.859
jan 1, 1981
At the date of observation
Value
Absolute change
Change from previous value
jan 1, 1971
1.285
+1.285
0.0%
jan 1, 1972
0.91
-0.375
-29.2%
jan 1, 1973
0.845
-0.065
-7.14%
jan 1, 1974
1.177
+0.332
39.28%
jan 1, 1975
4.971
+3.794
322.35%
jan 1, 1976
4.071
-0.901
-18.12%
jan 1, 1977
4.292
+0.222
5.44%
jan 1, 1978
3.966
-0.327
-7.61%
jan 1, 1979
3.623
-0.343
-8.64%
jan 1, 1980
9.615
+5.992
165.39%
jan 1, 1981
10.859
+1.244
12.94%
jan 1, 1982
7.924
-2.935
-27.03%
jan 1, 1983
5.335
-2.589
-32.67%
jan 1, 1984
6.202
+0.867
16.26%
jan 1, 1985
6.154
-0.048
-0.78%
jan 1, 1986
5.612
-0.542
-8.81%
jan 1, 1987
2.461
-3.151
-56.14%
jan 1, 1988
3.77
+1.309
53.18%
jan 1, 1989
3.169
-0.602
-15.95%
jan 1, 1990
4.279
+1.11
35.04%
jan 1, 1991
4.945
+0.666
15.56%
jan 1, 1992
2.436
-2.509
-50.73%
jan 1, 1993
2.785
+0.348
14.3%
jan 1, 1994
2.302
-0.483
-17.35%
jan 1, 1995
1.921
-0.38
-16.52%
jan 1, 1996
2.195
+0.274
14.23%
jan 1, 1997
2.602
+0.407
18.57%
jan 1, 1998
2.254
-0.349
-13.4%
jan 1, 1999
1.319
-0.935
-41.49%
jan 1, 2000
2.253
+0.934
70.84%
jan 1, 2001
3.722
+1.47
65.25%
jan 1, 2002
2.879
-0.844
-22.66%
jan 1, 2003
3.414
+0.536
18.61%
jan 1, 2004
4.046
+0.632
18.51%
jan 1, 2005
5.007
+0.96
23.73%
jan 1, 2006
6.374
+1.367
27.3%
jan 1, 2007
6.854
+0.481
7.54%
jan 1, 2008
6.676
-0.178
-2.59%
jan 1, 2009
7.286
+0.609
9.13%
jan 1, 2010
3.807
-3.479
-47.74%
jan 1, 2011
5.155
+1.348
35.41%
jan 1, 2012
6.676
+1.521
29.5%
jan 1, 2013
6.147
-0.529
-7.93%
jan 1, 2014
5.669
-0.478
-7.77%
jan 1, 2015
4.561
-1.108
-19.54%
jan 1, 2016
2.713
-1.848
-40.52%
Ranking of countries by current statistics by years


Comments: