29
/
en
AIzaSyAYiBZKx7MnpbEhh9jyipgxe19OcubqV5w
April 1, 2024
39610
IDA only
IDX
false
2
1
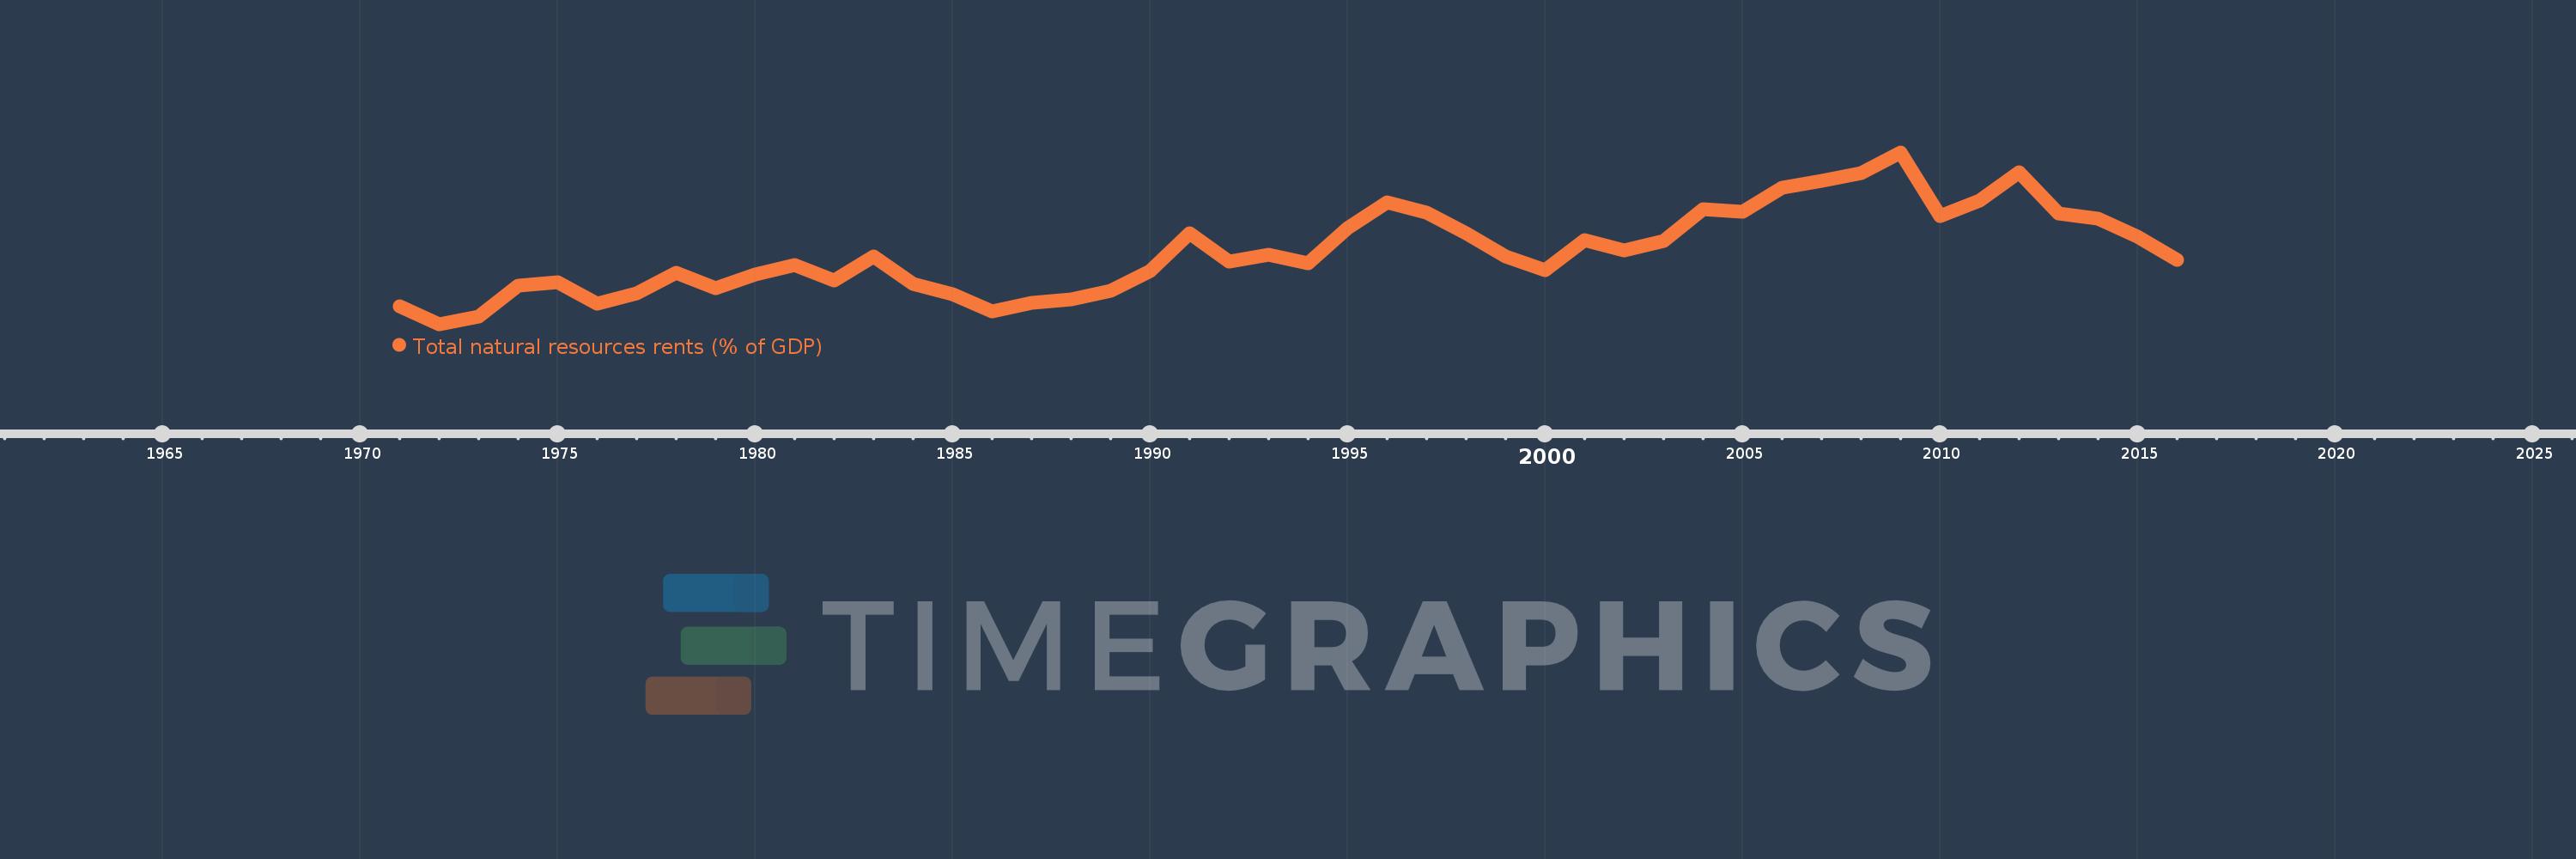
Total natural resources rents (% of GDP)
2016,2015,2014,2013,2012,2011,2010,2009,2008,2007,2006,2005,2004,2003,2002,2001,2000,1999,1998,1997,1996,1995,1994,1993,1992,1991,1990,1989,1988,1987,1986,1985,1984,1983,1982,1981,1980,1979,1978,1977,1976,1975,1974,1973,1972,1971
This statistics in other country:
AfghanistanAlbaniaAlgeriaAngolaArab WorldArgentinaArmeniaArubaAustraliaAustriaAzerbaijanBahamas, TheBahrainBangladeshBarbadosBelarusBelgiumBelizeBeninBhutanBoliviaBosnia and HerzegovinaBotswanaBrazilBrunei DarussalamBulgariaBurkina FasoBurundiCabo VerdeCambodiaCameroonCanadaCaribbean small statesCentral African RepublicCentral Europe and the BalticsChadChileChinaColombiaComorosCongo, Dem. Rep.Congo, Rep.Costa RicaCote d'IvoireCroatiaCubaCyprusCzech RepublicDenmarkDjiboutiDominicaDominican RepublicEarly-demographic dividendEast Asia & PacificEast Asia & Pacific (excluding high income)East Asia & Pacific (IDA & IBRD countries)EcuadorEgypt, Arab Rep.El SalvadorEquatorial GuineaEritreaEstoniaEthiopiaEuro areaEurope & Central AsiaEurope & Central Asia (excluding high income)Europe & Central Asia (IDA & IBRD countries)European UnionFijiFinlandFragile and conflict affected situationsFranceFrench PolynesiaGabonGambia, TheGeorgiaGermanyGhanaGreeceGuatemalaGuineaGuinea-BissauGuyanaHaitiHeavily indebted poor countries (HIPC)High incomeHondurasHong Kong SAR, ChinaHungaryIBRD onlyIcelandIDA & IBRD totalIDA blendIDA onlyIDA totalIndiaIndonesiaIran, Islamic Rep.IraqIrelandIsraelItalyJamaicaJapanJordanKazakhstanKenyaKiribatiKorea, Rep.KuwaitKyrgyz RepublicLao PDRLate-demographic dividendLatin America & Caribbean Latin America & Caribbean (excluding high income)Latin America & the Caribbean (IDA & IBRD countries)LatviaLeast developed countries: UN classificationLebanonLesothoLiberiaLibyaLithuaniaLow & middle incomeLow incomeLower middle incomeLuxembourgMacao SAR, ChinaMacedonia, FYRMadagascarMalawiMalaysiaMaldivesMaliMaltaMauritaniaMauritiusMexicoMiddle East & North AfricaMiddle East & North Africa (excluding high income)Middle East & North Africa (IDA & IBRD countries)Middle incomeMoldovaMongoliaMontenegroMoroccoMozambiqueMyanmarNamibiaNepalNetherlandsNew CaledoniaNew ZealandNicaraguaNigerNigeriaNorth AmericaNorwayOECD membersOmanOther small statesPacific island small statesPakistanPanamaPapua New GuineaParaguayPeruPhilippinesPolandPortugalPost-demographic dividendPre-demographic dividendQatarRomaniaRussian FederationRwandaSamoaSao Tome and PrincipeSaudi ArabiaSenegalSerbiaSeychellesSierra LeoneSingaporeSlovak RepublicSloveniaSmall statesSolomon IslandsSouth AfricaSouth AsiaSouth Asia (IDA & IBRD)South SudanSpainSri LankaSt. LuciaSt. Vincent and the GrenadinesSub-Saharan Africa Sub-Saharan Africa (excluding high income)Sub-Saharan Africa (IDA & IBRD countries)SudanSurinameSwazilandSwedenSwitzerlandSyrian Arab RepublicTajikistanTanzaniaThailandTimor-LesteTogoTongaTrinidad and TobagoTunisiaTurkeyTurkmenistanUgandaUkraineUnited Arab EmiratesUnited KingdomUnited StatesUpper middle incomeUruguayUzbekistanVanuatuVenezuela, RBVietnamWorldYemen, Rep.ZambiaZimbabwe Timeline:
This timeline shows a graph from 1971 to 2016 of IDA only. No data until 1970. Number of actual observations by date: 46.
Source name:
World Development Indicators
Source organization:
Estimates based on sources and methods described in "The Changing Wealth of Nations: Measuring Sustainable Development in the New Millennium" (World Bank, 2011).
Categories, topics:
Energy & Mining, Environment
Last updated:
apr 23, 2017
Indicators value changes by year
At the date of observation
Value
Absolute change
Change from previous value
jan 1, 1971
4.816
+4.816
0.0%
jan 1, 1972
3.663
-1.154
-23.95%
jan 1, 1973
4.167
+0.505
13.78%
jan 1, 1974
6.091
+1.923
46.15%
jan 1, 1975
6.346
+0.255
4.19%
jan 1, 1976
4.946
-1.4
-22.06%
jan 1, 1977
5.608
+0.662
13.38%
jan 1, 1978
6.937
+1.33
23.71%
jan 1, 1979
5.938
-1.0
-14.41%
jan 1, 1980
6.812
+0.874
14.73%
jan 1, 1981
7.397
+0.585
8.59%
jan 1, 1982
6.431
-0.966
-13.06%
jan 1, 1983
7.94
+1.51
23.47%
jan 1, 1984
6.189
-1.751
-22.05%
jan 1, 1985
5.56
-0.63
-10.17%
jan 1, 1986
4.449
-1.111
-19.98%
jan 1, 1987
5.03
+0.581
13.06%
jan 1, 1988
5.233
+0.203
4.04%
jan 1, 1989
5.757
+0.524
10.01%
jan 1, 1990
7.054
+1.297
22.54%
jan 1, 1991
9.398
+2.344
33.23%
jan 1, 1992
7.602
-1.796
-19.11%
jan 1, 1993
8.042
+0.44
5.79%
jan 1, 1994
7.495
-0.546
-6.8%
jan 1, 1995
9.754
+2.258
30.13%
jan 1, 1996
11.401
+1.648
16.89%
jan 1, 1997
10.754
-0.647
-5.68%
jan 1, 1998
9.424
-1.33
-12.37%
jan 1, 1999
7.958
-1.466
-15.55%
jan 1, 2000
7.111
-0.848
-10.65%
jan 1, 2001
8.985
+1.874
26.35%
jan 1, 2002
8.333
-0.652
-7.26%
jan 1, 2003
8.96
+0.628
7.53%
jan 1, 2004
10.947
+1.986
22.17%
jan 1, 2005
10.764
-0.183
-1.67%
jan 1, 2006
12.318
+1.554
14.44%
jan 1, 2007
12.758
+0.44
3.57%
jan 1, 2008
13.225
+0.467
3.66%
jan 1, 2009
14.54
+1.315
9.94%
jan 1, 2010
10.495
-4.045
-27.82%
jan 1, 2011
11.495
+1.0
9.53%
jan 1, 2012
13.269
+1.774
15.43%
jan 1, 2013
10.676
-2.593
-19.54%
jan 1, 2014
10.373
-0.302
-2.83%
jan 1, 2015
9.203
-1.171
-11.29%
jan 1, 2016
7.747
-1.455
-15.81%
Ranking of countries by current statistics by years


Comments: