29
/
en
AIzaSyAYiBZKx7MnpbEhh9jyipgxe19OcubqV5w
April 1, 2024
63109
World
WLD
false
2
1
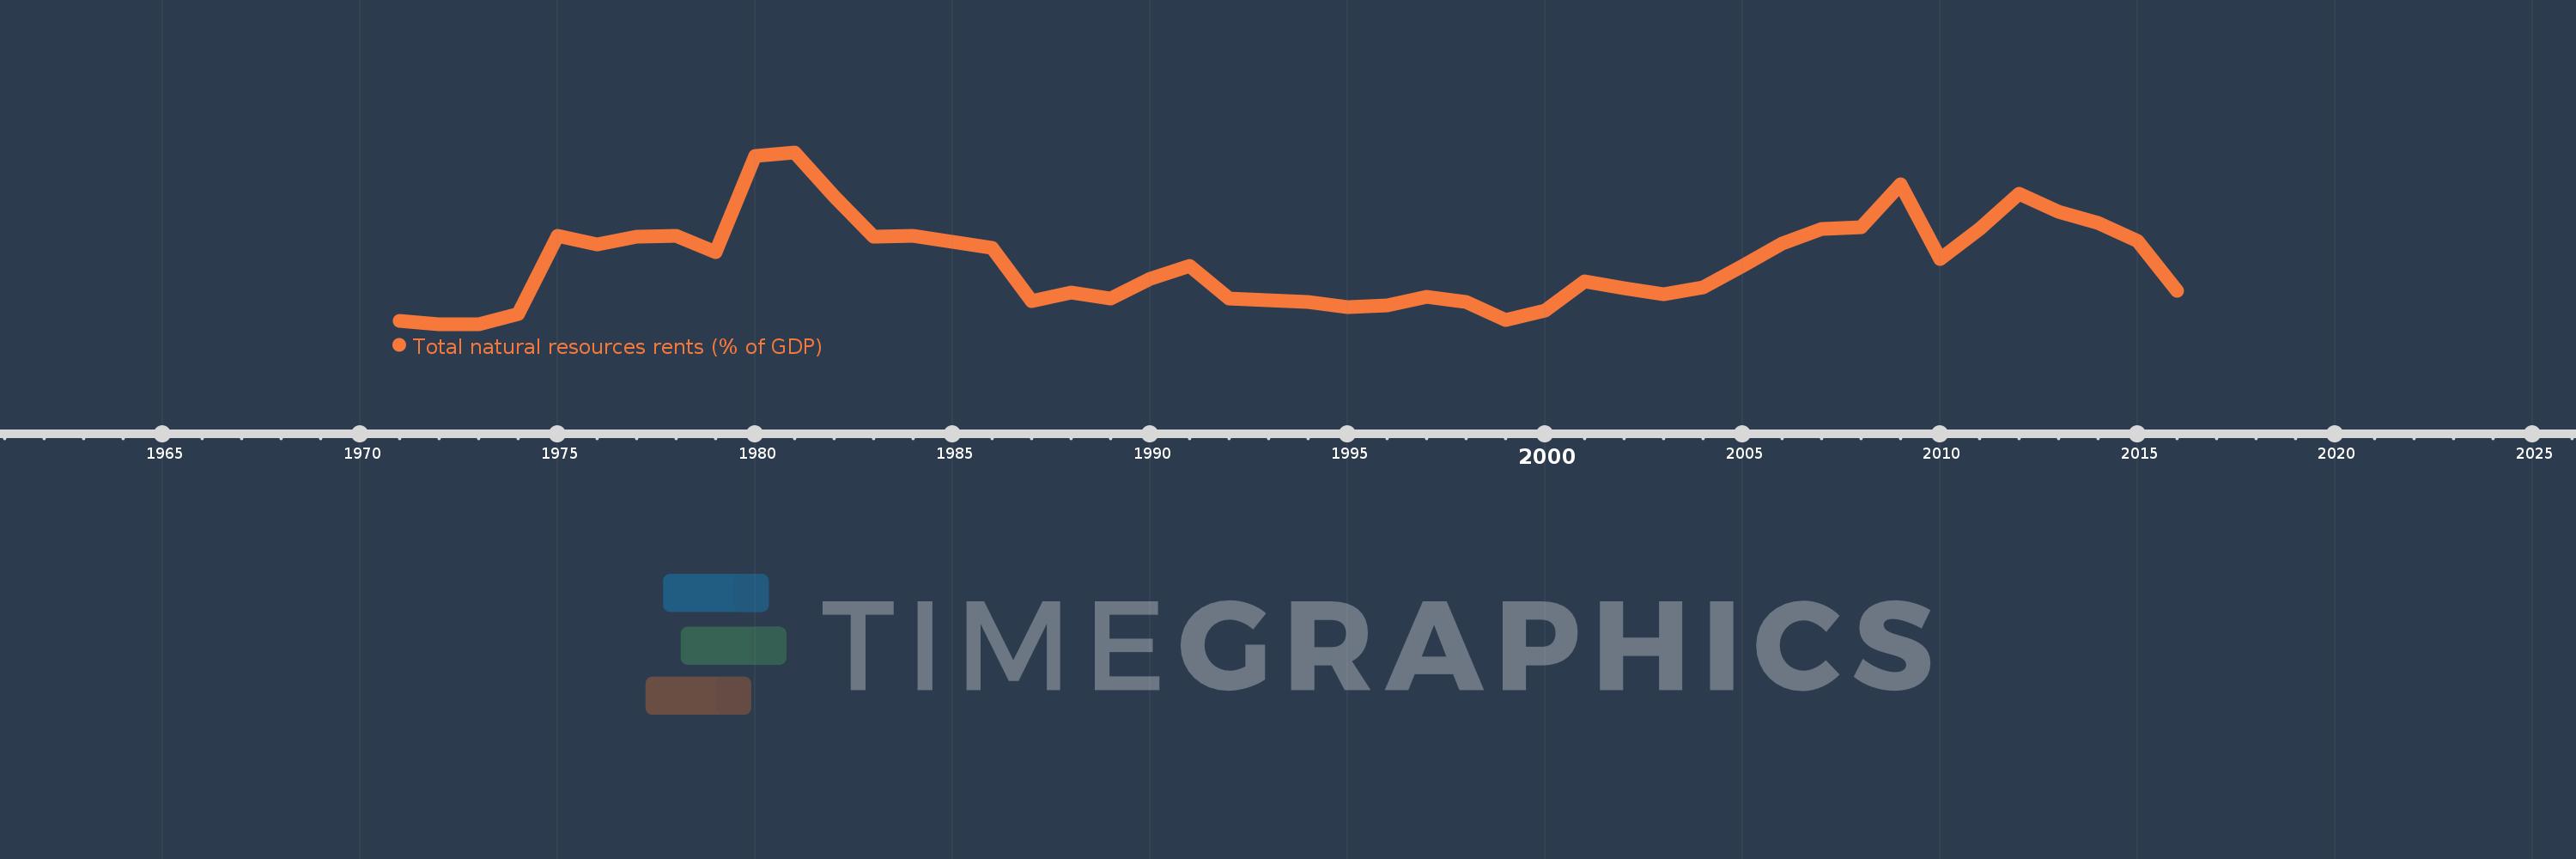
Total natural resources rents (% of GDP)
2016,2015,2014,2013,2012,2011,2010,2009,2008,2007,2006,2005,2004,2003,2002,2001,2000,1999,1998,1997,1996,1995,1994,1993,1992,1991,1990,1989,1988,1987,1986,1985,1984,1983,1982,1981,1980,1979,1978,1977,1976,1975,1974,1973,1972,1971
This statistics in other country:
AfghanistanAlbaniaAlgeriaAngolaArab WorldArgentinaArmeniaArubaAustraliaAustriaAzerbaijanBahamas, TheBahrainBangladeshBarbadosBelarusBelgiumBelizeBeninBhutanBoliviaBosnia and HerzegovinaBotswanaBrazilBrunei DarussalamBulgariaBurkina FasoBurundiCabo VerdeCambodiaCameroonCanadaCaribbean small statesCentral African RepublicCentral Europe and the BalticsChadChileChinaColombiaComorosCongo, Dem. Rep.Congo, Rep.Costa RicaCote d'IvoireCroatiaCubaCyprusCzech RepublicDenmarkDjiboutiDominicaDominican RepublicEarly-demographic dividendEast Asia & PacificEast Asia & Pacific (excluding high income)East Asia & Pacific (IDA & IBRD countries)EcuadorEgypt, Arab Rep.El SalvadorEquatorial GuineaEritreaEstoniaEthiopiaEuro areaEurope & Central AsiaEurope & Central Asia (excluding high income)Europe & Central Asia (IDA & IBRD countries)European UnionFijiFinlandFragile and conflict affected situationsFranceFrench PolynesiaGabonGambia, TheGeorgiaGermanyGhanaGreeceGuatemalaGuineaGuinea-BissauGuyanaHaitiHeavily indebted poor countries (HIPC)High incomeHondurasHong Kong SAR, ChinaHungaryIBRD onlyIcelandIDA & IBRD totalIDA blendIDA onlyIDA totalIndiaIndonesiaIran, Islamic Rep.IraqIrelandIsraelItalyJamaicaJapanJordanKazakhstanKenyaKiribatiKorea, Rep.KuwaitKyrgyz RepublicLao PDRLate-demographic dividendLatin America & Caribbean Latin America & Caribbean (excluding high income)Latin America & the Caribbean (IDA & IBRD countries)LatviaLeast developed countries: UN classificationLebanonLesothoLiberiaLibyaLithuaniaLow & middle incomeLow incomeLower middle incomeLuxembourgMacao SAR, ChinaMacedonia, FYRMadagascarMalawiMalaysiaMaldivesMaliMaltaMauritaniaMauritiusMexicoMiddle East & North AfricaMiddle East & North Africa (excluding high income)Middle East & North Africa (IDA & IBRD countries)Middle incomeMoldovaMongoliaMontenegroMoroccoMozambiqueMyanmarNamibiaNepalNetherlandsNew CaledoniaNew ZealandNicaraguaNigerNigeriaNorth AmericaNorwayOECD membersOmanOther small statesPacific island small statesPakistanPanamaPapua New GuineaParaguayPeruPhilippinesPolandPortugalPost-demographic dividendPre-demographic dividendQatarRomaniaRussian FederationRwandaSamoaSao Tome and PrincipeSaudi ArabiaSenegalSerbiaSeychellesSierra LeoneSingaporeSlovak RepublicSloveniaSmall statesSolomon IslandsSouth AfricaSouth AsiaSouth Asia (IDA & IBRD)South SudanSpainSri LankaSt. LuciaSt. Vincent and the GrenadinesSub-Saharan Africa Sub-Saharan Africa (excluding high income)Sub-Saharan Africa (IDA & IBRD countries)SudanSurinameSwazilandSwedenSwitzerlandSyrian Arab RepublicTajikistanTanzaniaThailandTimor-LesteTogoTongaTrinidad and TobagoTunisiaTurkeyTurkmenistanUgandaUkraineUnited Arab EmiratesUnited KingdomUnited StatesUpper middle incomeUruguayUzbekistanVanuatuVenezuela, RBVietnamWorldYemen, Rep.ZambiaZimbabwe Timeline:
This timeline shows a graph from 1971 to 2016 of World. No data until 1970. Number of actual observations by date: 46.
Source name:
World Development Indicators
Source organization:
Estimates based on sources and methods described in "The Changing Wealth of Nations: Measuring Sustainable Development in the New Millennium" (World Bank, 2011).
Categories, topics:
Energy & Mining, Environment
Last updated:
apr 23, 2017
Indicators value changes by year
At the date of observation
Value
Absolute change
Change from previous value
jan 1, 1971
0.817
+0.817
0.0%
jan 1, 1972
0.707
-0.11
-13.46%
jan 1, 1973
0.717
+0.01
1.48%
jan 1, 1974
1.018
+0.3
41.88%
jan 1, 1975
3.467
+2.449
240.56%
jan 1, 1976
3.197
-0.269
-7.77%
jan 1, 1977
3.446
+0.248
7.76%
jan 1, 1978
3.464
+0.019
0.54%
jan 1, 1979
2.944
-0.521
-15.03%
jan 1, 1980
5.966
+3.023
102.69%
jan 1, 1981
6.066
+0.1
1.67%
jan 1, 1982
4.694
-1.372
-22.61%
jan 1, 1983
3.437
-1.257
-26.77%
jan 1, 1984
3.463
+0.026
0.76%
jan 1, 1985
3.278
-0.186
-5.36%
jan 1, 1986
3.083
-0.195
-5.95%
jan 1, 1987
1.429
-1.654
-53.66%
jan 1, 1988
1.696
+0.267
18.72%
jan 1, 1989
1.501
-0.195
-11.5%
jan 1, 1990
2.125
+0.624
41.59%
jan 1, 1991
2.535
+0.41
19.27%
jan 1, 1992
1.515
-1.02
-40.23%
jan 1, 1993
1.45
-0.065
-4.32%
jan 1, 1994
1.409
-0.041
-2.8%
jan 1, 1995
1.231
-0.178
-12.62%
jan 1, 1996
1.281
+0.05
4.07%
jan 1, 1997
1.556
+0.275
21.46%
jan 1, 1998
1.394
-0.162
-10.44%
jan 1, 1999
0.843
-0.551
-39.52%
jan 1, 2000
1.123
+0.28
33.23%
jan 1, 2001
2.049
+0.925
82.39%
jan 1, 2002
1.841
-0.207
-10.11%
jan 1, 2003
1.637
-0.204
-11.08%
jan 1, 2004
1.847
+0.209
12.79%
jan 1, 2005
2.524
+0.677
36.67%
jan 1, 2006
3.235
+0.712
28.2%
jan 1, 2007
3.667
+0.432
13.35%
jan 1, 2008
3.736
+0.068
1.86%
jan 1, 2009
5.066
+1.331
35.62%
jan 1, 2010
2.733
-2.333
-46.05%
jan 1, 2011
3.677
+0.944
34.54%
jan 1, 2012
4.775
+1.098
29.86%
jan 1, 2013
4.21
-0.565
-11.83%
jan 1, 2014
3.864
-0.346
-8.21%
jan 1, 2015
3.295
-0.57
-14.74%
jan 1, 2016
1.743
-1.552
-47.09%
Ranking of countries by current statistics by years


Comments: