29
/
en
AIzaSyAYiBZKx7MnpbEhh9jyipgxe19OcubqV5w
April 1, 2024
86672
Bhutan
BTN
true
2
1
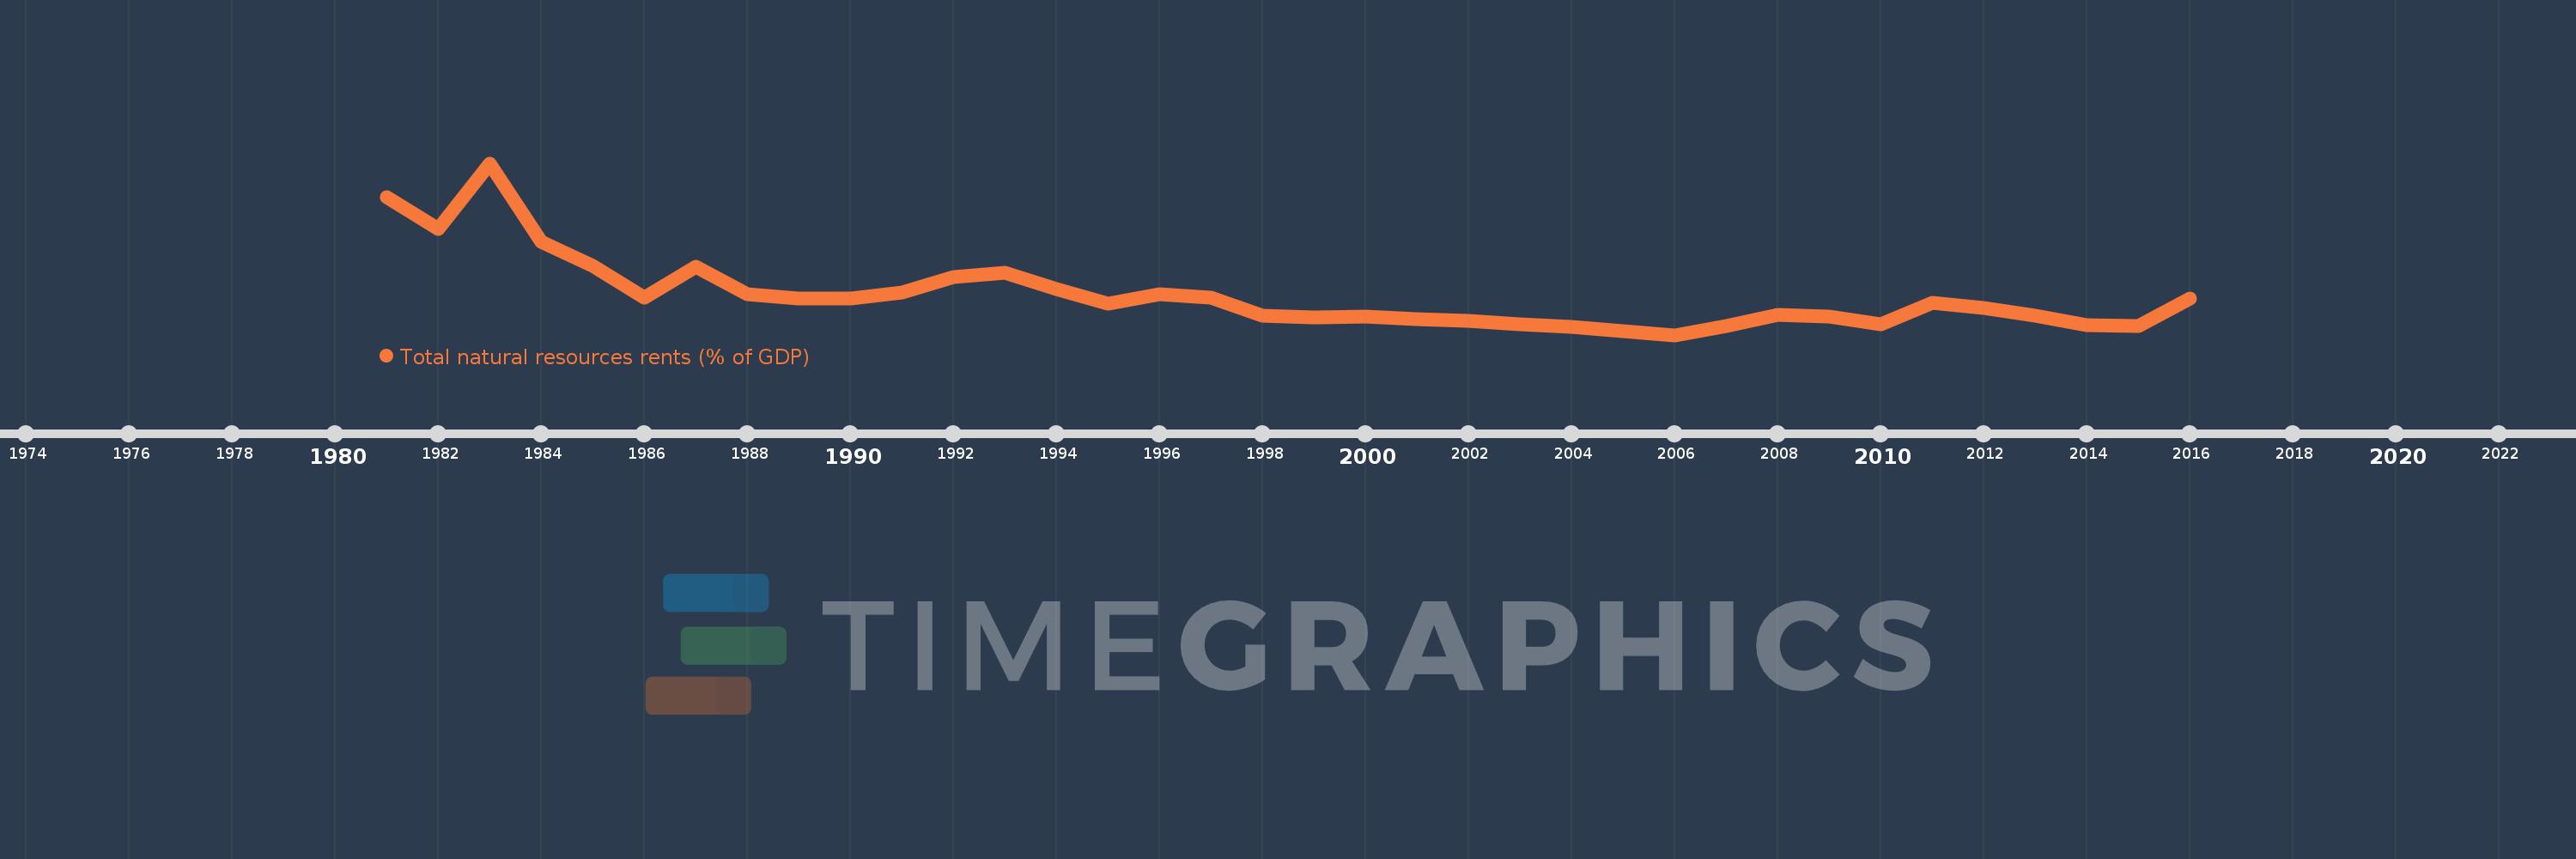
Total natural resources rents (% of GDP)
2016,2015,2014,2013,2012,2011,2010,2009,2008,2007,2006,2005,2004,2003,2002,2001,2000,1999,1998,1997,1996,1995,1994,1993,1992,1991,1990,1989,1988,1987,1986,1985,1984,1983,1982,1981
This statistics in other country:
AfghanistanAlbaniaAlgeriaAngolaArab WorldArgentinaArmeniaArubaAustraliaAustriaAzerbaijanBahamas, TheBahrainBangladeshBarbadosBelarusBelgiumBelizeBeninBhutanBoliviaBosnia and HerzegovinaBotswanaBrazilBrunei DarussalamBulgariaBurkina FasoBurundiCabo VerdeCambodiaCameroonCanadaCaribbean small statesCentral African RepublicCentral Europe and the BalticsChadChileChinaColombiaComorosCongo, Dem. Rep.Congo, Rep.Costa RicaCote d'IvoireCroatiaCubaCyprusCzech RepublicDenmarkDjiboutiDominicaDominican RepublicEarly-demographic dividendEast Asia & PacificEast Asia & Pacific (excluding high income)East Asia & Pacific (IDA & IBRD countries)EcuadorEgypt, Arab Rep.El SalvadorEquatorial GuineaEritreaEstoniaEthiopiaEuro areaEurope & Central AsiaEurope & Central Asia (excluding high income)Europe & Central Asia (IDA & IBRD countries)European UnionFijiFinlandFragile and conflict affected situationsFranceFrench PolynesiaGabonGambia, TheGeorgiaGermanyGhanaGreeceGuatemalaGuineaGuinea-BissauGuyanaHaitiHeavily indebted poor countries (HIPC)High incomeHondurasHong Kong SAR, ChinaHungaryIBRD onlyIcelandIDA & IBRD totalIDA blendIDA onlyIDA totalIndiaIndonesiaIran, Islamic Rep.IraqIrelandIsraelItalyJamaicaJapanJordanKazakhstanKenyaKiribatiKorea, Rep.KuwaitKyrgyz RepublicLao PDRLate-demographic dividendLatin America & Caribbean Latin America & Caribbean (excluding high income)Latin America & the Caribbean (IDA & IBRD countries)LatviaLeast developed countries: UN classificationLebanonLesothoLiberiaLibyaLithuaniaLow & middle incomeLow incomeLower middle incomeLuxembourgMacao SAR, ChinaMacedonia, FYRMadagascarMalawiMalaysiaMaldivesMaliMaltaMauritaniaMauritiusMexicoMiddle East & North AfricaMiddle East & North Africa (excluding high income)Middle East & North Africa (IDA & IBRD countries)Middle incomeMoldovaMongoliaMontenegroMoroccoMozambiqueMyanmarNamibiaNepalNetherlandsNew CaledoniaNew ZealandNicaraguaNigerNigeriaNorth AmericaNorwayOECD membersOmanOther small statesPacific island small statesPakistanPanamaPapua New GuineaParaguayPeruPhilippinesPolandPortugalPost-demographic dividendPre-demographic dividendQatarRomaniaRussian FederationRwandaSamoaSao Tome and PrincipeSaudi ArabiaSenegalSerbiaSeychellesSierra LeoneSingaporeSlovak RepublicSloveniaSmall statesSolomon IslandsSouth AfricaSouth AsiaSouth Asia (IDA & IBRD)South SudanSpainSri LankaSt. LuciaSt. Vincent and the GrenadinesSub-Saharan Africa Sub-Saharan Africa (excluding high income)Sub-Saharan Africa (IDA & IBRD countries)SudanSurinameSwazilandSwedenSwitzerlandSyrian Arab RepublicTajikistanTanzaniaThailandTimor-LesteTogoTongaTrinidad and TobagoTunisiaTurkeyTurkmenistanUgandaUkraineUnited Arab EmiratesUnited KingdomUnited StatesUpper middle incomeUruguayUzbekistanVanuatuVenezuela, RBVietnamWorldYemen, Rep.ZambiaZimbabwe Timeline:
This timeline shows a graph from 1981 to 2016 of Bhutan. No data until 1980. Number of actual observations by date: 36.
Source name:
World Development Indicators
Source organization:
Estimates based on sources and methods described in "The Changing Wealth of Nations: Measuring Sustainable Development in the New Millennium" (World Bank, 2011).
Categories, topics:
Energy & Mining, Environment
Last updated:
apr 23, 2017
Indicators value changes by year
At the date of observation
Value
Absolute change
Change from previous value
jan 1, 1981
13.67
+13.67
0.0%
jan 1, 1982
11.126
-2.543
-18.6%
jan 1, 1983
16.41
+5.283
47.48%
jan 1, 1984
10.093
-6.316
-38.49%
jan 1, 1985
8.172
-1.921
-19.03%
jan 1, 1986
5.605
-2.567
-31.41%
jan 1, 1987
8.046
+2.44
43.53%
jan 1, 1988
5.899
-2.147
-26.68%
jan 1, 1989
5.517
-0.382
-6.47%
jan 1, 1990
5.53
+0.013
0.24%
jan 1, 1991
6.009
+0.478
8.65%
jan 1, 1992
7.279
+1.27
21.14%
jan 1, 1993
7.604
+0.325
4.47%
jan 1, 1994
6.257
-1.347
-17.71%
jan 1, 1995
5.119
-1.139
-18.2%
jan 1, 1996
5.862
+0.743
14.52%
jan 1, 1997
5.585
-0.276
-4.72%
jan 1, 1998
4.114
-1.471
-26.34%
jan 1, 1999
4.033
-0.082
-1.99%
jan 1, 2000
4.078
+0.045
1.11%
jan 1, 2001
3.856
-0.221
-5.42%
jan 1, 2002
3.747
-0.109
-2.83%
jan 1, 2003
3.467
-0.28
-7.47%
jan 1, 2004
3.248
-0.219
-6.32%
jan 1, 2005
2.883
-0.365
-11.25%
jan 1, 2006
2.583
-0.3
-10.4%
jan 1, 2007
3.312
+0.729
28.21%
jan 1, 2008
4.194
+0.882
26.65%
jan 1, 2009
4.085
-0.11
-2.61%
jan 1, 2010
3.441
-0.644
-15.76%
jan 1, 2011
5.153
+1.712
49.77%
jan 1, 2012
4.791
-0.363
-7.04%
jan 1, 2013
4.128
-0.663
-13.84%
jan 1, 2014
3.381
-0.747
-18.09%
jan 1, 2015
3.302
-0.078
-2.32%
jan 1, 2016
5.522
+2.219
67.2%
Ranking of countries by current statistics by years


Comments: