29
/
en
AIzaSyAYiBZKx7MnpbEhh9jyipgxe19OcubqV5w
April 1, 2024
240071
Sierra Leone
SLE
true
2
1
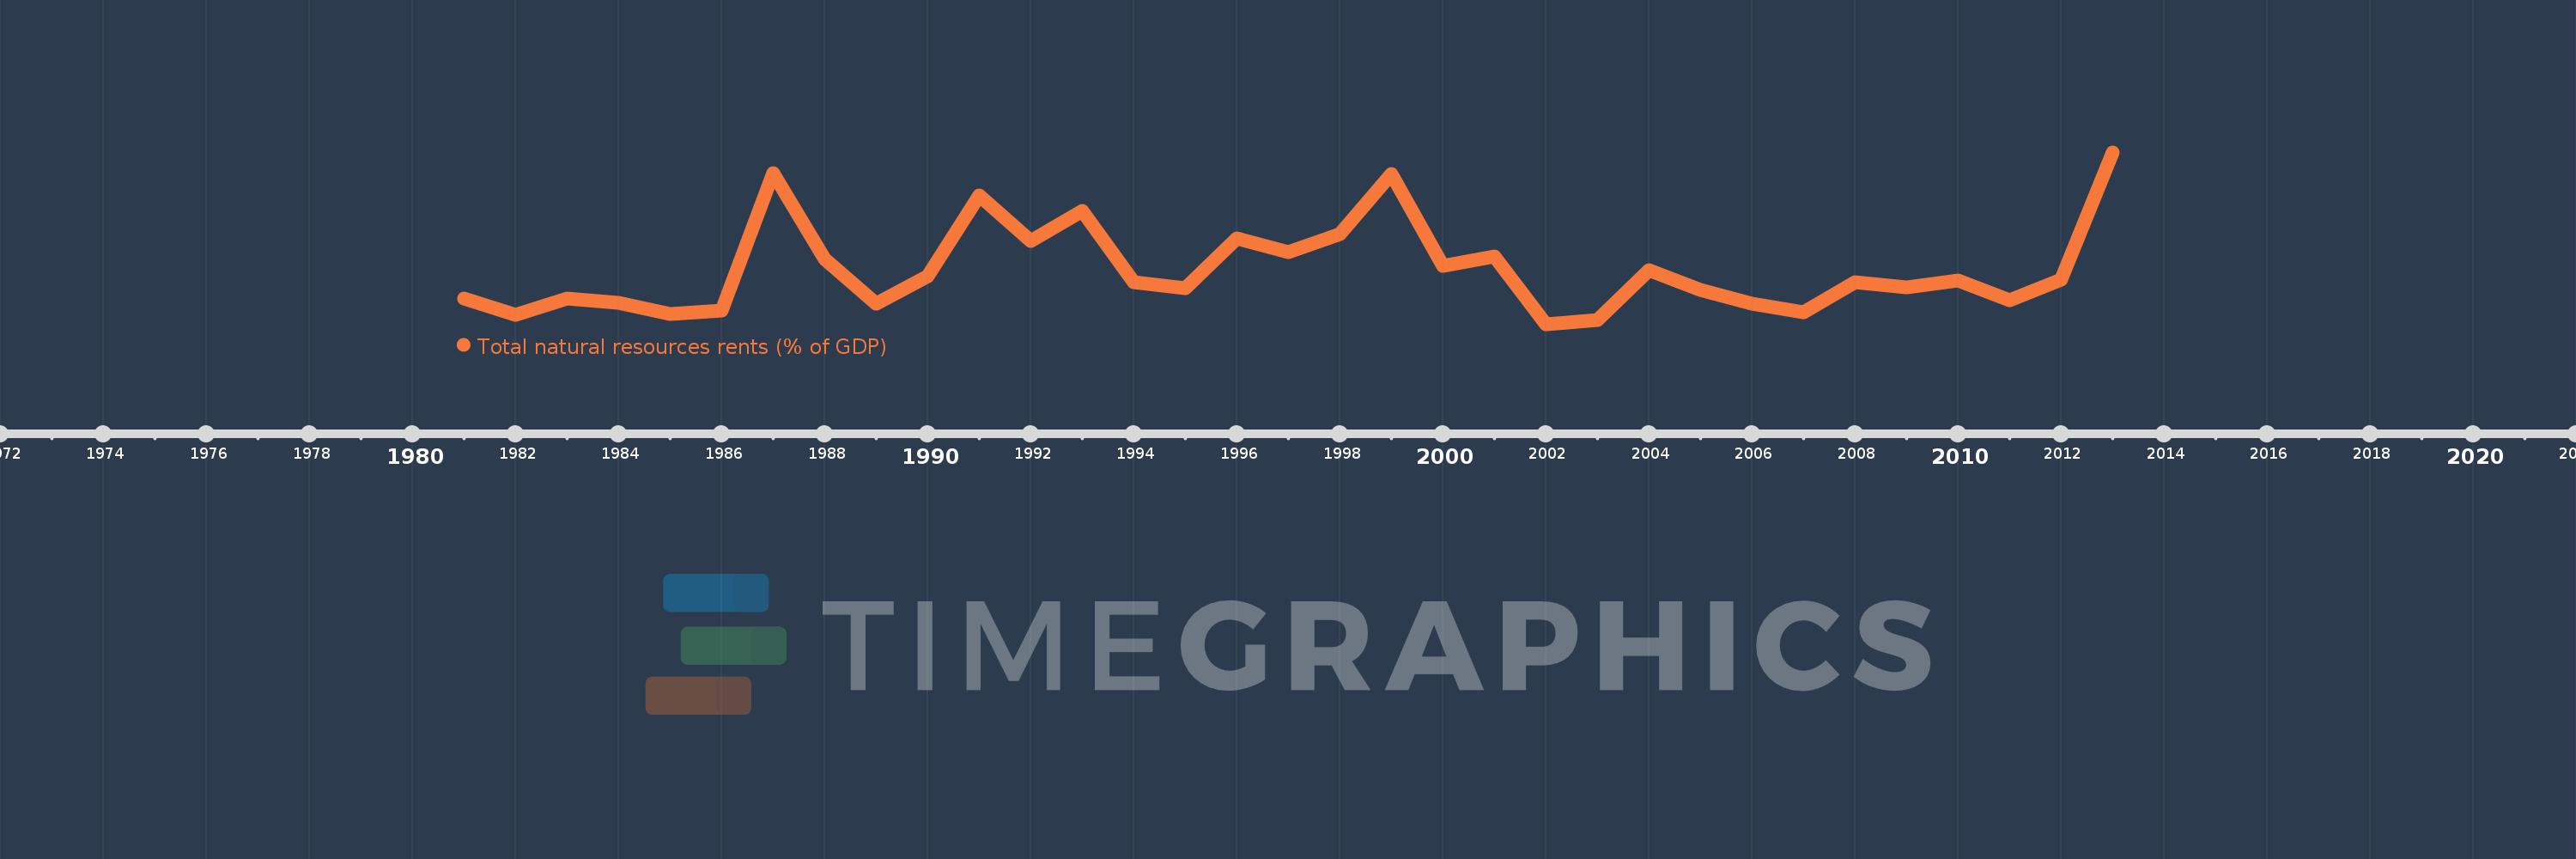
Total natural resources rents (% of GDP)
2013,2012,2011,2010,2009,2008,2007,2006,2005,2004,2003,2002,2001,2000,1999,1998,1997,1996,1995,1994,1993,1992,1991,1990,1989,1988,1987,1986,1985,1984,1983,1982,1981
This statistics in other country:
AfghanistanAlbaniaAlgeriaAngolaArab WorldArgentinaArmeniaArubaAustraliaAustriaAzerbaijanBahamas, TheBahrainBangladeshBarbadosBelarusBelgiumBelizeBeninBhutanBoliviaBosnia and HerzegovinaBotswanaBrazilBrunei DarussalamBulgariaBurkina FasoBurundiCabo VerdeCambodiaCameroonCanadaCaribbean small statesCentral African RepublicCentral Europe and the BalticsChadChileChinaColombiaComorosCongo, Dem. Rep.Congo, Rep.Costa RicaCote d'IvoireCroatiaCubaCyprusCzech RepublicDenmarkDjiboutiDominicaDominican RepublicEarly-demographic dividendEast Asia & PacificEast Asia & Pacific (excluding high income)East Asia & Pacific (IDA & IBRD countries)EcuadorEgypt, Arab Rep.El SalvadorEquatorial GuineaEritreaEstoniaEthiopiaEuro areaEurope & Central AsiaEurope & Central Asia (excluding high income)Europe & Central Asia (IDA & IBRD countries)European UnionFijiFinlandFragile and conflict affected situationsFranceFrench PolynesiaGabonGambia, TheGeorgiaGermanyGhanaGreeceGuatemalaGuineaGuinea-BissauGuyanaHaitiHeavily indebted poor countries (HIPC)High incomeHondurasHong Kong SAR, ChinaHungaryIBRD onlyIcelandIDA & IBRD totalIDA blendIDA onlyIDA totalIndiaIndonesiaIran, Islamic Rep.IraqIrelandIsraelItalyJamaicaJapanJordanKazakhstanKenyaKiribatiKorea, Rep.KuwaitKyrgyz RepublicLao PDRLate-demographic dividendLatin America & Caribbean Latin America & Caribbean (excluding high income)Latin America & the Caribbean (IDA & IBRD countries)LatviaLeast developed countries: UN classificationLebanonLesothoLiberiaLibyaLithuaniaLow & middle incomeLow incomeLower middle incomeLuxembourgMacao SAR, ChinaMacedonia, FYRMadagascarMalawiMalaysiaMaldivesMaliMaltaMauritaniaMauritiusMexicoMiddle East & North AfricaMiddle East & North Africa (excluding high income)Middle East & North Africa (IDA & IBRD countries)Middle incomeMoldovaMongoliaMontenegroMoroccoMozambiqueMyanmarNamibiaNepalNetherlandsNew CaledoniaNew ZealandNicaraguaNigerNigeriaNorth AmericaNorwayOECD membersOmanOther small statesPacific island small statesPakistanPanamaPapua New GuineaParaguayPeruPhilippinesPolandPortugalPost-demographic dividendPre-demographic dividendQatarRomaniaRussian FederationRwandaSamoaSao Tome and PrincipeSaudi ArabiaSenegalSerbiaSeychellesSierra LeoneSingaporeSlovak RepublicSloveniaSmall statesSolomon IslandsSouth AfricaSouth AsiaSouth Asia (IDA & IBRD)South SudanSpainSri LankaSt. LuciaSt. Vincent and the GrenadinesSub-Saharan Africa Sub-Saharan Africa (excluding high income)Sub-Saharan Africa (IDA & IBRD countries)SudanSurinameSwazilandSwedenSwitzerlandSyrian Arab RepublicTajikistanTanzaniaThailandTimor-LesteTogoTongaTrinidad and TobagoTunisiaTurkeyTurkmenistanUgandaUkraineUnited Arab EmiratesUnited KingdomUnited StatesUpper middle incomeUruguayUzbekistanVanuatuVenezuela, RBVietnamWorldYemen, Rep.ZambiaZimbabwe Timeline:
This timeline shows a graph from 1981 to 2013 of Sierra Leone. No data until 1980. Number of actual observations by date: 33.
Source name:
World Development Indicators
Source organization:
Estimates based on sources and methods described in "The Changing Wealth of Nations: Measuring Sustainable Development in the New Millennium" (World Bank, 2011).
Categories, topics:
Energy & Mining, Environment
Last updated:
apr 23, 2017
Indicators value changes by year
Maximum:
23.632
jan 1, 2013
At the date of observation
Value
Absolute change
Change from previous value
jan 1, 1981
10.473
+10.473
0.0%
jan 1, 1982
8.945
-1.528
-14.59%
jan 1, 1983
10.433
+1.489
16.64%
jan 1, 1984
10.032
-0.402
-3.85%
jan 1, 1985
9.045
-0.987
-9.84%
jan 1, 1986
9.362
+0.317
3.51%
jan 1, 1987
21.729
+12.368
132.11%
jan 1, 1988
14.037
-7.692
-35.4%
jan 1, 1989
9.995
-4.042
-28.8%
jan 1, 1990
12.488
+2.493
24.94%
jan 1, 1991
19.782
+7.294
58.4%
jan 1, 1992
15.601
-4.181
-21.14%
jan 1, 1993
18.341
+2.74
17.56%
jan 1, 1994
11.879
-6.462
-35.23%
jan 1, 1995
11.365
-0.513
-4.32%
jan 1, 1996
15.888
+4.522
39.79%
jan 1, 1997
14.607
-1.28
-8.06%
jan 1, 1998
16.223
+1.616
11.06%
jan 1, 1999
21.656
+5.433
33.49%
jan 1, 2000
13.367
-8.289
-38.28%
jan 1, 2001
14.254
+0.888
6.64%
jan 1, 2002
8.123
-6.132
-43.02%
jan 1, 2003
8.522
+0.399
4.91%
jan 1, 2004
13.014
+4.492
52.71%
jan 1, 2005
11.244
-1.77
-13.6%
jan 1, 2006
9.941
-1.302
-11.58%
jan 1, 2007
9.163
-0.778
-7.83%
jan 1, 2008
11.932
+2.769
30.22%
jan 1, 2009
11.481
-0.451
-3.78%
jan 1, 2010
12.087
+0.606
5.28%
jan 1, 2011
10.311
-1.775
-14.69%
jan 1, 2012
12.153
+1.841
17.86%
jan 1, 2013
23.632
+11.479
94.46%
Ranking of countries by current statistics by years


Comments: