29
/
en
AIzaSyAYiBZKx7MnpbEhh9jyipgxe19OcubqV5w
April 1, 2024
276252
United Kingdom
GBR
true
2
1
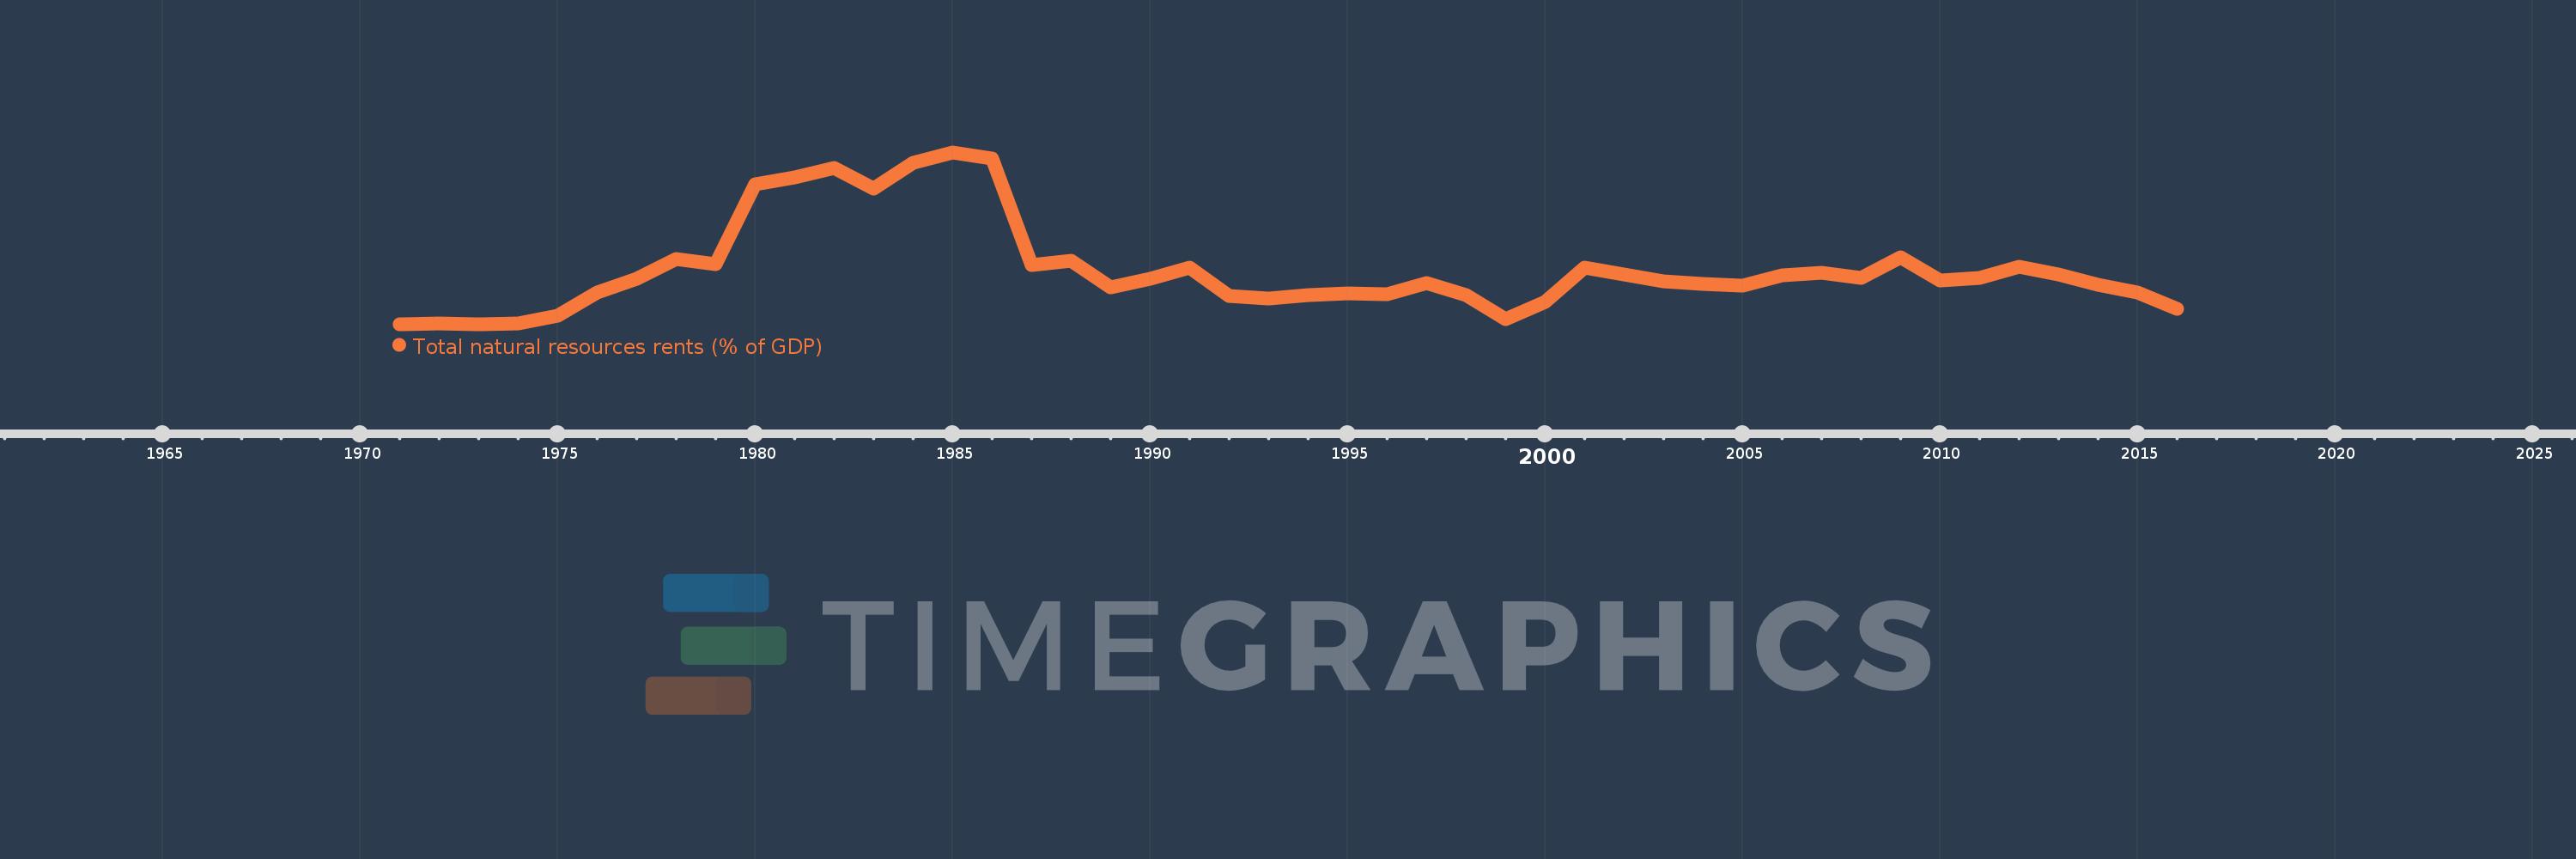
Total natural resources rents (% of GDP)
2016,2015,2014,2013,2012,2011,2010,2009,2008,2007,2006,2005,2004,2003,2002,2001,2000,1999,1998,1997,1996,1995,1994,1993,1992,1991,1990,1989,1988,1987,1986,1985,1984,1983,1982,1981,1980,1979,1978,1977,1976,1975,1974,1973,1972,1971
This statistics in other country:
AfghanistanAlbaniaAlgeriaAngolaArab WorldArgentinaArmeniaArubaAustraliaAustriaAzerbaijanBahamas, TheBahrainBangladeshBarbadosBelarusBelgiumBelizeBeninBhutanBoliviaBosnia and HerzegovinaBotswanaBrazilBrunei DarussalamBulgariaBurkina FasoBurundiCabo VerdeCambodiaCameroonCanadaCaribbean small statesCentral African RepublicCentral Europe and the BalticsChadChileChinaColombiaComorosCongo, Dem. Rep.Congo, Rep.Costa RicaCote d'IvoireCroatiaCubaCyprusCzech RepublicDenmarkDjiboutiDominicaDominican RepublicEarly-demographic dividendEast Asia & PacificEast Asia & Pacific (excluding high income)East Asia & Pacific (IDA & IBRD countries)EcuadorEgypt, Arab Rep.El SalvadorEquatorial GuineaEritreaEstoniaEthiopiaEuro areaEurope & Central AsiaEurope & Central Asia (excluding high income)Europe & Central Asia (IDA & IBRD countries)European UnionFijiFinlandFragile and conflict affected situationsFranceFrench PolynesiaGabonGambia, TheGeorgiaGermanyGhanaGreeceGuatemalaGuineaGuinea-BissauGuyanaHaitiHeavily indebted poor countries (HIPC)High incomeHondurasHong Kong SAR, ChinaHungaryIBRD onlyIcelandIDA & IBRD totalIDA blendIDA onlyIDA totalIndiaIndonesiaIran, Islamic Rep.IraqIrelandIsraelItalyJamaicaJapanJordanKazakhstanKenyaKiribatiKorea, Rep.KuwaitKyrgyz RepublicLao PDRLate-demographic dividendLatin America & Caribbean Latin America & Caribbean (excluding high income)Latin America & the Caribbean (IDA & IBRD countries)LatviaLeast developed countries: UN classificationLebanonLesothoLiberiaLibyaLithuaniaLow & middle incomeLow incomeLower middle incomeLuxembourgMacao SAR, ChinaMacedonia, FYRMadagascarMalawiMalaysiaMaldivesMaliMaltaMauritaniaMauritiusMexicoMiddle East & North AfricaMiddle East & North Africa (excluding high income)Middle East & North Africa (IDA & IBRD countries)Middle incomeMoldovaMongoliaMontenegroMoroccoMozambiqueMyanmarNamibiaNepalNetherlandsNew CaledoniaNew ZealandNicaraguaNigerNigeriaNorth AmericaNorwayOECD membersOmanOther small statesPacific island small statesPakistanPanamaPapua New GuineaParaguayPeruPhilippinesPolandPortugalPost-demographic dividendPre-demographic dividendQatarRomaniaRussian FederationRwandaSamoaSao Tome and PrincipeSaudi ArabiaSenegalSerbiaSeychellesSierra LeoneSingaporeSlovak RepublicSloveniaSmall statesSolomon IslandsSouth AfricaSouth AsiaSouth Asia (IDA & IBRD)South SudanSpainSri LankaSt. LuciaSt. Vincent and the GrenadinesSub-Saharan Africa Sub-Saharan Africa (excluding high income)Sub-Saharan Africa (IDA & IBRD countries)SudanSurinameSwazilandSwedenSwitzerlandSyrian Arab RepublicTajikistanTanzaniaThailandTimor-LesteTogoTongaTrinidad and TobagoTunisiaTurkeyTurkmenistanUgandaUkraineUnited Arab EmiratesUnited KingdomUnited StatesUpper middle incomeUruguayUzbekistanVanuatuVenezuela, RBVietnamWorldYemen, Rep.ZambiaZimbabwe Timeline:
This timeline shows a graph from 1971 to 2016 of United Kingdom. No data until 1970. Number of actual observations by date: 46.
Source name:
World Development Indicators
Source organization:
Estimates based on sources and methods described in "The Changing Wealth of Nations: Measuring Sustainable Development in the New Millennium" (World Bank, 2011).
Categories, topics:
Energy & Mining, Environment
Last updated:
apr 23, 2017
Indicators value changes by year
At the date of observation
Value
Absolute change
Change from previous value
jan 1, 1971
0.07
+0.07
0.0%
jan 1, 1972
0.081
+0.01
14.78%
jan 1, 1973
0.07
-0.011
-13.05%
jan 1, 1974
0.084
+0.014
19.56%
jan 1, 1975
0.218
+0.134
159.23%
jan 1, 1976
0.62
+0.402
184.32%
jan 1, 1977
0.857
+0.237
38.2%
jan 1, 1978
1.201
+0.345
40.26%
jan 1, 1979
1.111
-0.091
-7.56%
jan 1, 1980
2.502
+1.392
125.31%
jan 1, 1981
2.623
+0.12
4.81%
jan 1, 1982
2.78
+0.157
6.0%
jan 1, 1983
2.434
-0.346
-12.43%
jan 1, 1984
2.872
+0.438
17.99%
jan 1, 1985
3.055
+0.183
6.38%
jan 1, 1986
2.943
-0.113
-3.69%
jan 1, 1987
1.092
-1.851
-62.9%
jan 1, 1988
1.172
+0.08
7.31%
jan 1, 1989
0.707
-0.464
-39.62%
jan 1, 1990
0.857
+0.15
21.2%
jan 1, 1991
1.049
+0.192
22.35%
jan 1, 1992
0.554
-0.495
-47.22%
jan 1, 1993
0.509
-0.044
-8.01%
jan 1, 1994
0.583
+0.074
14.45%
jan 1, 1995
0.605
+0.022
3.72%
jan 1, 1996
0.598
-0.006
-1.02%
jan 1, 1997
0.779
+0.18
30.16%
jan 1, 1998
0.579
-0.2
-25.62%
jan 1, 1999
0.164
-0.416
-71.76%
jan 1, 2000
0.453
+0.289
176.63%
jan 1, 2001
1.047
+0.594
131.29%
jan 1, 2002
0.94
-0.106
-10.16%
jan 1, 2003
0.808
-0.132
-14.08%
jan 1, 2004
0.767
-0.041
-5.04%
jan 1, 2005
0.741
-0.026
-3.39%
jan 1, 2006
0.919
+0.178
24.01%
jan 1, 2007
0.968
+0.049
5.35%
jan 1, 2008
0.869
-0.1
-10.31%
jan 1, 2009
1.24
+0.372
42.82%
jan 1, 2010
0.834
-0.406
-32.73%
jan 1, 2011
0.88
+0.046
5.5%
jan 1, 2012
1.073
+0.193
21.89%
jan 1, 2013
0.929
-0.144
-13.41%
jan 1, 2014
0.762
-0.167
-17.99%
jan 1, 2015
0.614
-0.148
-19.48%
jan 1, 2016
0.338
-0.276
-44.94%
Ranking of countries by current statistics by years


Comments: