29
/
en
AIzaSyAYiBZKx7MnpbEhh9jyipgxe19OcubqV5w
April 1, 2024
45750
Low & middle income
LMY
false
2
1
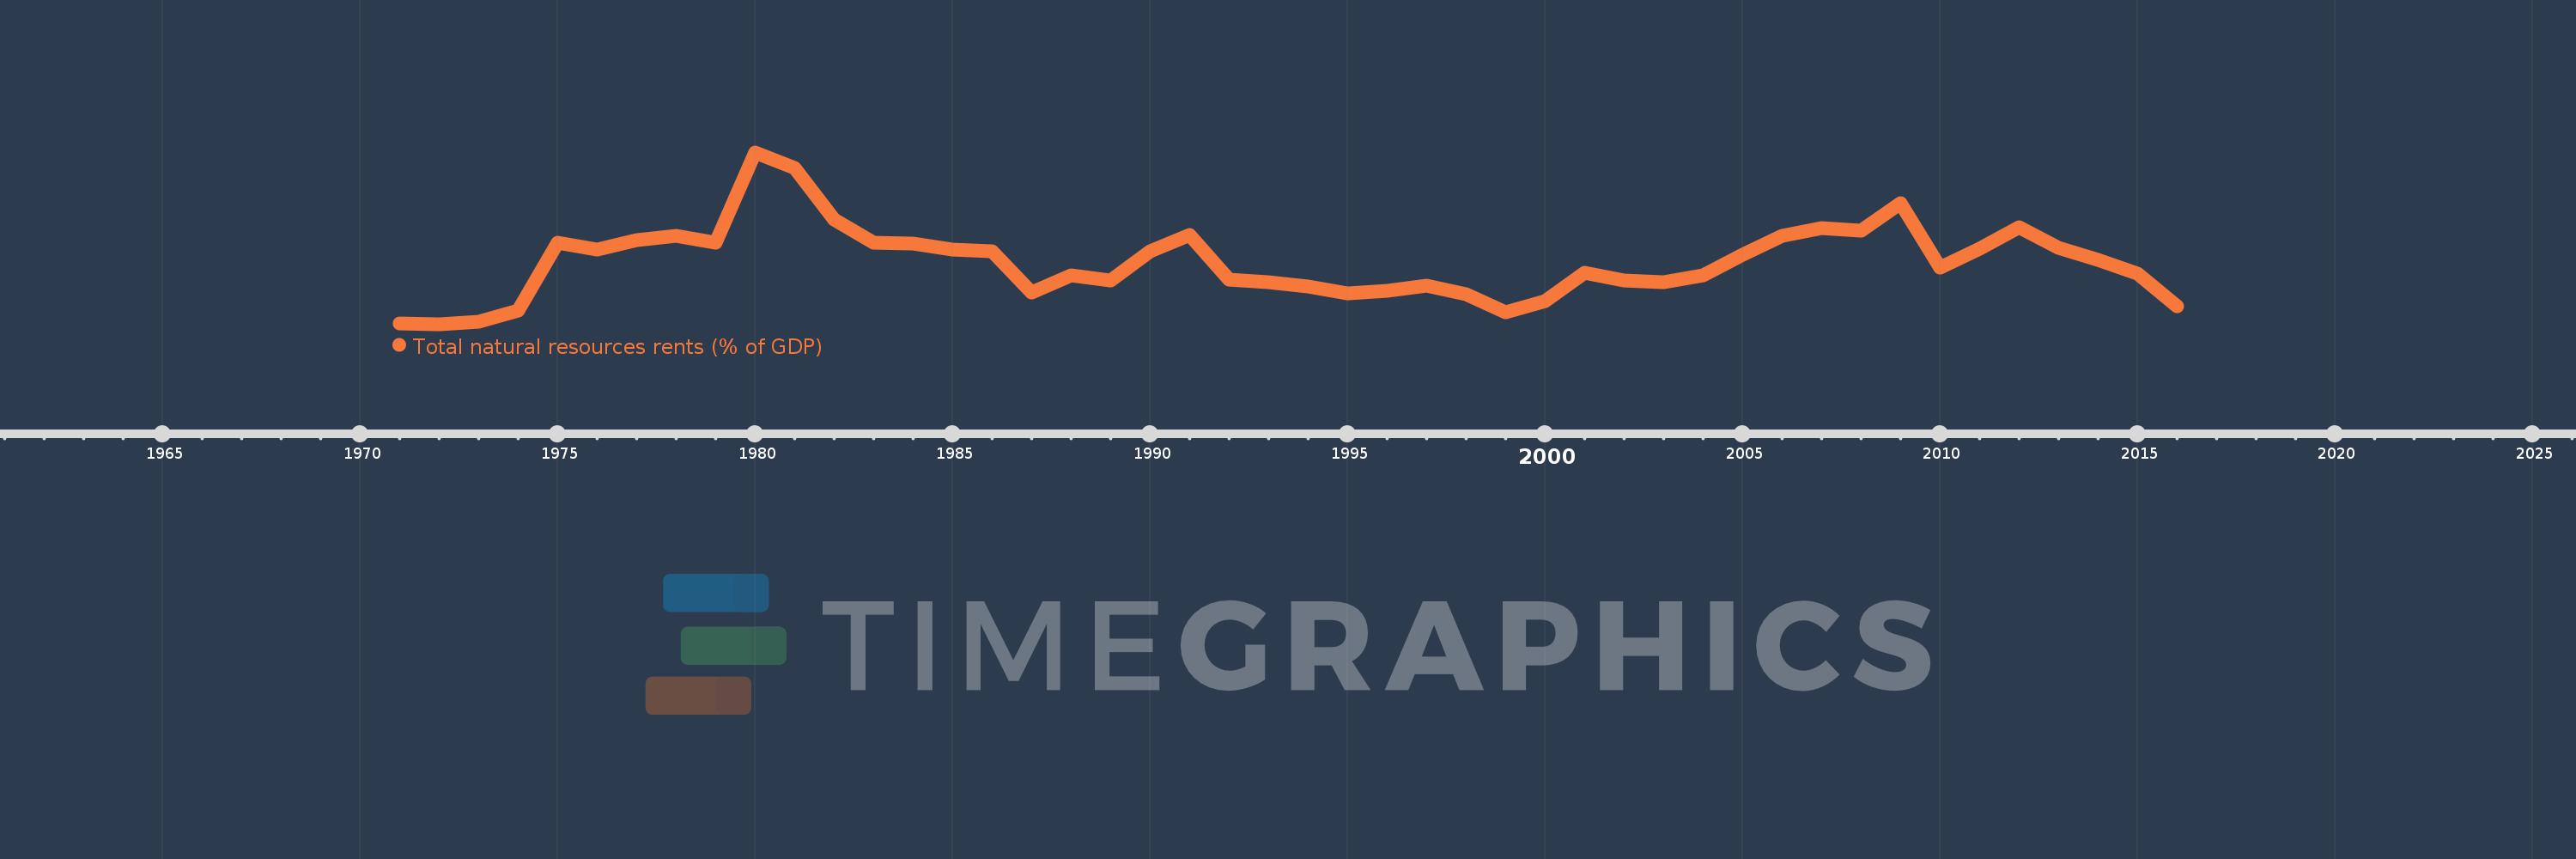
Total natural resources rents (% of GDP)
2016,2015,2014,2013,2012,2011,2010,2009,2008,2007,2006,2005,2004,2003,2002,2001,2000,1999,1998,1997,1996,1995,1994,1993,1992,1991,1990,1989,1988,1987,1986,1985,1984,1983,1982,1981,1980,1979,1978,1977,1976,1975,1974,1973,1972,1971
This statistics in other country:
AfghanistanAlbaniaAlgeriaAngolaArab WorldArgentinaArmeniaArubaAustraliaAustriaAzerbaijanBahamas, TheBahrainBangladeshBarbadosBelarusBelgiumBelizeBeninBhutanBoliviaBosnia and HerzegovinaBotswanaBrazilBrunei DarussalamBulgariaBurkina FasoBurundiCabo VerdeCambodiaCameroonCanadaCaribbean small statesCentral African RepublicCentral Europe and the BalticsChadChileChinaColombiaComorosCongo, Dem. Rep.Congo, Rep.Costa RicaCote d'IvoireCroatiaCubaCyprusCzech RepublicDenmarkDjiboutiDominicaDominican RepublicEarly-demographic dividendEast Asia & PacificEast Asia & Pacific (excluding high income)East Asia & Pacific (IDA & IBRD countries)EcuadorEgypt, Arab Rep.El SalvadorEquatorial GuineaEritreaEstoniaEthiopiaEuro areaEurope & Central AsiaEurope & Central Asia (excluding high income)Europe & Central Asia (IDA & IBRD countries)European UnionFijiFinlandFragile and conflict affected situationsFranceFrench PolynesiaGabonGambia, TheGeorgiaGermanyGhanaGreeceGuatemalaGuineaGuinea-BissauGuyanaHaitiHeavily indebted poor countries (HIPC)High incomeHondurasHong Kong SAR, ChinaHungaryIBRD onlyIcelandIDA & IBRD totalIDA blendIDA onlyIDA totalIndiaIndonesiaIran, Islamic Rep.IraqIrelandIsraelItalyJamaicaJapanJordanKazakhstanKenyaKiribatiKorea, Rep.KuwaitKyrgyz RepublicLao PDRLate-demographic dividendLatin America & Caribbean Latin America & Caribbean (excluding high income)Latin America & the Caribbean (IDA & IBRD countries)LatviaLeast developed countries: UN classificationLebanonLesothoLiberiaLibyaLithuaniaLow & middle incomeLow incomeLower middle incomeLuxembourgMacao SAR, ChinaMacedonia, FYRMadagascarMalawiMalaysiaMaldivesMaliMaltaMauritaniaMauritiusMexicoMiddle East & North AfricaMiddle East & North Africa (excluding high income)Middle East & North Africa (IDA & IBRD countries)Middle incomeMoldovaMongoliaMontenegroMoroccoMozambiqueMyanmarNamibiaNepalNetherlandsNew CaledoniaNew ZealandNicaraguaNigerNigeriaNorth AmericaNorwayOECD membersOmanOther small statesPacific island small statesPakistanPanamaPapua New GuineaParaguayPeruPhilippinesPolandPortugalPost-demographic dividendPre-demographic dividendQatarRomaniaRussian FederationRwandaSamoaSao Tome and PrincipeSaudi ArabiaSenegalSerbiaSeychellesSierra LeoneSingaporeSlovak RepublicSloveniaSmall statesSolomon IslandsSouth AfricaSouth AsiaSouth Asia (IDA & IBRD)South SudanSpainSri LankaSt. LuciaSt. Vincent and the GrenadinesSub-Saharan Africa Sub-Saharan Africa (excluding high income)Sub-Saharan Africa (IDA & IBRD countries)SudanSurinameSwazilandSwedenSwitzerlandSyrian Arab RepublicTajikistanTanzaniaThailandTimor-LesteTogoTongaTrinidad and TobagoTunisiaTurkeyTurkmenistanUgandaUkraineUnited Arab EmiratesUnited KingdomUnited StatesUpper middle incomeUruguayUzbekistanVanuatuVenezuela, RBVietnamWorldYemen, Rep.ZambiaZimbabwe Timeline:
This timeline shows a graph from 1971 to 2016 of Low & middle income. No data until 1970. Number of actual observations by date: 46.
Source name:
World Development Indicators
Source organization:
Estimates based on sources and methods described in "The Changing Wealth of Nations: Measuring Sustainable Development in the New Millennium" (World Bank, 2011).
Categories, topics:
Energy & Mining, Environment
Last updated:
apr 23, 2017
Indicators value changes by year
Maximum:
15.751
jan 1, 1980
At the date of observation
Value
Absolute change
Change from previous value
jan 1, 1971
1.552
+1.552
0.0%
jan 1, 1972
1.458
-0.094
-6.04%
jan 1, 1973
1.667
+0.209
14.35%
jan 1, 1974
2.597
+0.929
55.75%
jan 1, 1975
8.258
+5.661
218.02%
jan 1, 1976
7.667
-0.591
-7.16%
jan 1, 1977
8.442
+0.775
10.11%
jan 1, 1978
8.826
+0.384
4.54%
jan 1, 1979
8.273
-0.553
-6.27%
jan 1, 1980
15.751
+7.479
90.4%
jan 1, 1981
14.45
-1.301
-8.26%
jan 1, 1982
10.144
-4.307
-29.8%
jan 1, 1983
8.215
-1.928
-19.01%
jan 1, 1984
8.18
-0.035
-0.43%
jan 1, 1985
7.699
-0.482
-5.89%
jan 1, 1986
7.549
-0.149
-1.94%
jan 1, 1987
4.092
-3.457
-45.79%
jan 1, 1988
5.518
+1.426
34.83%
jan 1, 1989
5.113
-0.405
-7.34%
jan 1, 1990
7.503
+2.39
46.75%
jan 1, 1991
8.848
+1.345
17.92%
jan 1, 1992
5.178
-3.67
-41.48%
jan 1, 1993
4.952
-0.226
-4.36%
jan 1, 1994
4.598
-0.354
-7.15%
jan 1, 1995
4.039
-0.559
-12.16%
jan 1, 1996
4.254
+0.215
5.33%
jan 1, 1997
4.65
+0.396
9.3%
jan 1, 1998
3.958
-0.692
-14.87%
jan 1, 1999
2.437
-1.522
-38.44%
jan 1, 2000
3.371
+0.934
38.32%
jan 1, 2001
5.744
+2.373
70.41%
jan 1, 2002
5.108
-0.636
-11.07%
jan 1, 2003
4.946
-0.162
-3.16%
jan 1, 2004
5.511
+0.565
11.42%
jan 1, 2005
7.271
+1.76
31.93%
jan 1, 2006
8.841
+1.571
21.6%
jan 1, 2007
9.479
+0.638
7.21%
jan 1, 2008
9.261
-0.218
-2.3%
jan 1, 2009
11.51
+2.249
24.28%
jan 1, 2010
6.178
-5.332
-46.32%
jan 1, 2011
7.707
+1.529
24.75%
jan 1, 2012
9.494
+1.787
23.18%
jan 1, 2013
7.823
-1.671
-17.6%
jan 1, 2014
6.837
-0.986
-12.6%
jan 1, 2015
5.665
-1.172
-17.14%
jan 1, 2016
2.971
-2.695
-47.57%
Ranking of countries by current statistics by years


Comments: