29
/
en
AIzaSyAYiBZKx7MnpbEhh9jyipgxe19OcubqV5w
April 1, 2024
49679
Middle East & North Africa (excluding high income)
MNA
false
2
1
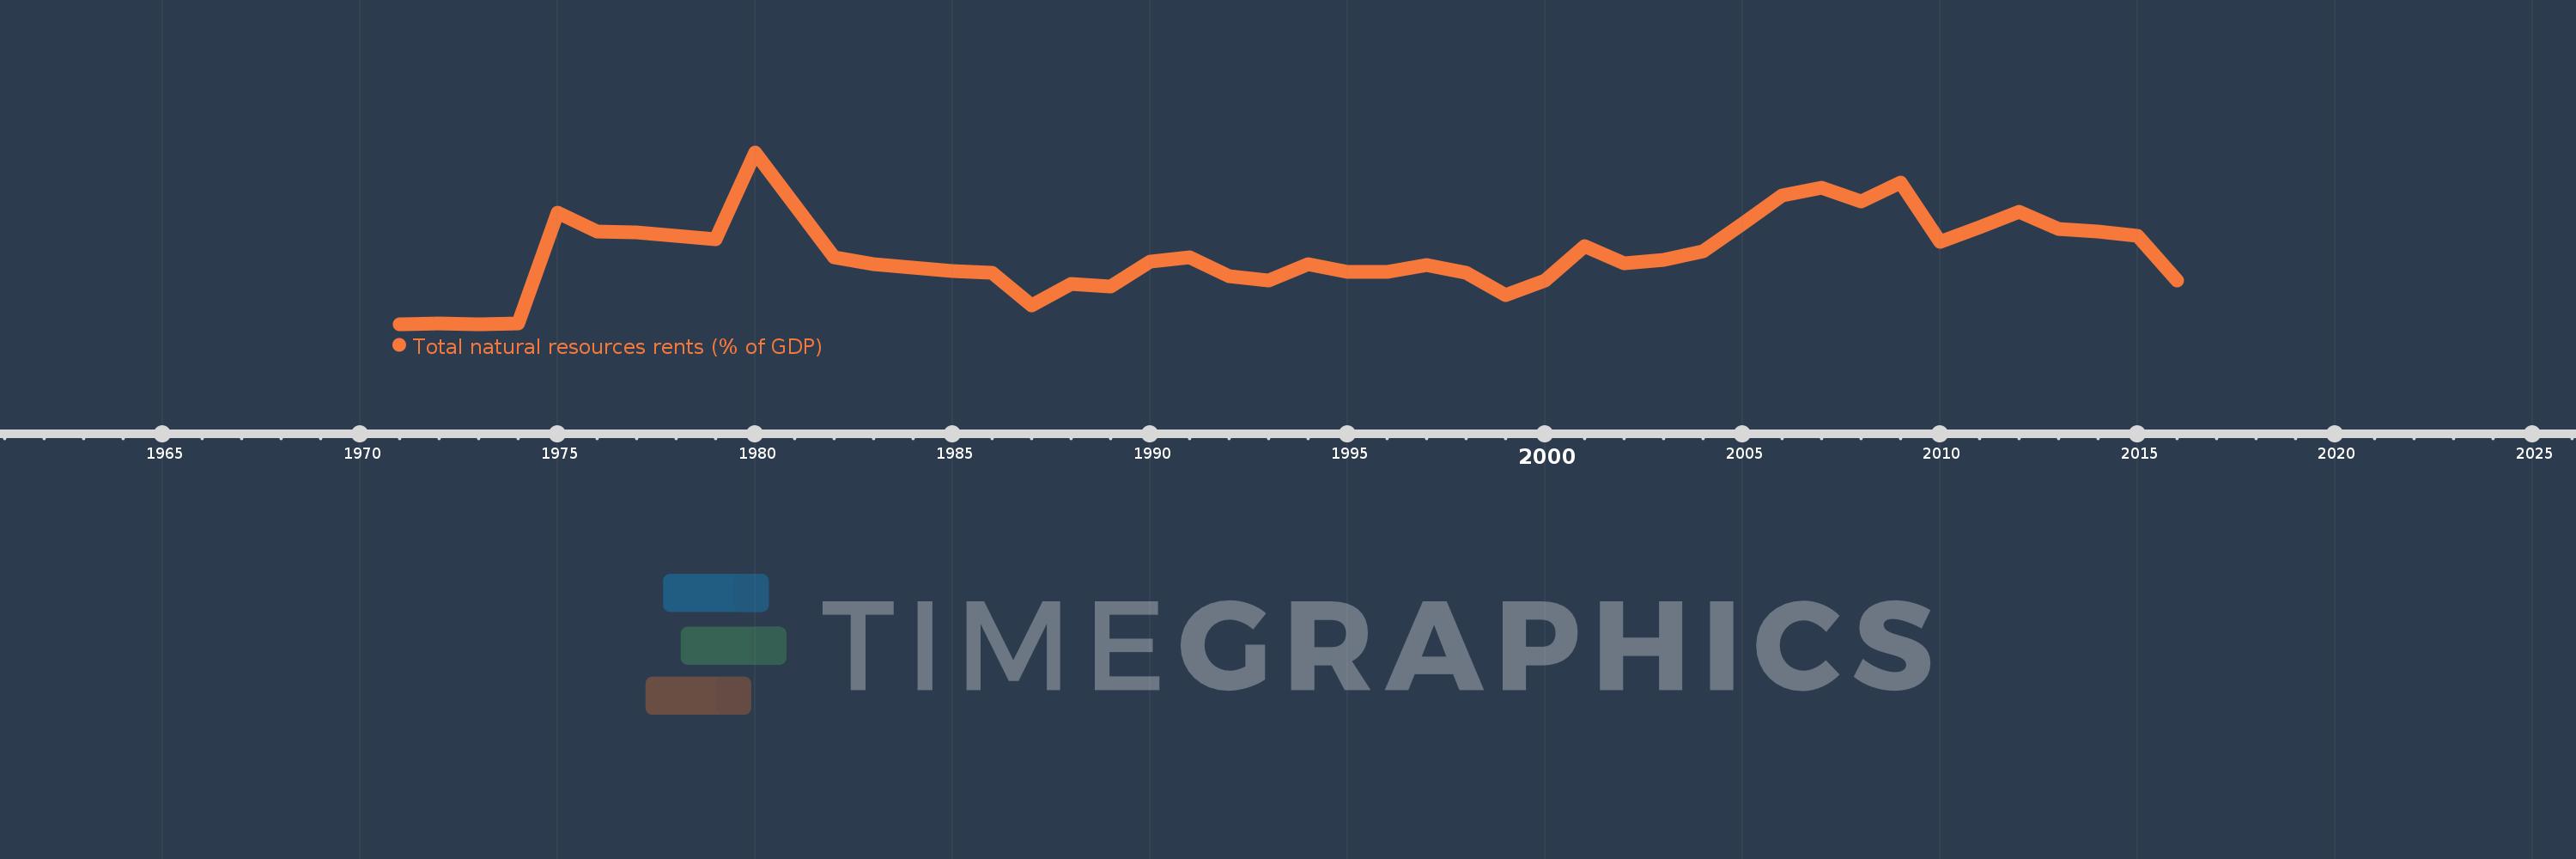
Total natural resources rents (% of GDP)
2016,2015,2014,2013,2012,2011,2010,2009,2008,2007,2006,2005,2004,2003,2002,2001,2000,1999,1998,1997,1996,1995,1994,1993,1992,1991,1990,1989,1988,1987,1986,1985,1984,1983,1982,1981,1980,1979,1978,1977,1976,1975,1974,1973,1972,1971
This statistics in other country:
AfghanistanAlbaniaAlgeriaAngolaArab WorldArgentinaArmeniaArubaAustraliaAustriaAzerbaijanBahamas, TheBahrainBangladeshBarbadosBelarusBelgiumBelizeBeninBhutanBoliviaBosnia and HerzegovinaBotswanaBrazilBrunei DarussalamBulgariaBurkina FasoBurundiCabo VerdeCambodiaCameroonCanadaCaribbean small statesCentral African RepublicCentral Europe and the BalticsChadChileChinaColombiaComorosCongo, Dem. Rep.Congo, Rep.Costa RicaCote d'IvoireCroatiaCubaCyprusCzech RepublicDenmarkDjiboutiDominicaDominican RepublicEarly-demographic dividendEast Asia & PacificEast Asia & Pacific (excluding high income)East Asia & Pacific (IDA & IBRD countries)EcuadorEgypt, Arab Rep.El SalvadorEquatorial GuineaEritreaEstoniaEthiopiaEuro areaEurope & Central AsiaEurope & Central Asia (excluding high income)Europe & Central Asia (IDA & IBRD countries)European UnionFijiFinlandFragile and conflict affected situationsFranceFrench PolynesiaGabonGambia, TheGeorgiaGermanyGhanaGreeceGuatemalaGuineaGuinea-BissauGuyanaHaitiHeavily indebted poor countries (HIPC)High incomeHondurasHong Kong SAR, ChinaHungaryIBRD onlyIcelandIDA & IBRD totalIDA blendIDA onlyIDA totalIndiaIndonesiaIran, Islamic Rep.IraqIrelandIsraelItalyJamaicaJapanJordanKazakhstanKenyaKiribatiKorea, Rep.KuwaitKyrgyz RepublicLao PDRLate-demographic dividendLatin America & Caribbean Latin America & Caribbean (excluding high income)Latin America & the Caribbean (IDA & IBRD countries)LatviaLeast developed countries: UN classificationLebanonLesothoLiberiaLibyaLithuaniaLow & middle incomeLow incomeLower middle incomeLuxembourgMacao SAR, ChinaMacedonia, FYRMadagascarMalawiMalaysiaMaldivesMaliMaltaMauritaniaMauritiusMexicoMiddle East & North AfricaMiddle East & North Africa (excluding high income)Middle East & North Africa (IDA & IBRD countries)Middle incomeMoldovaMongoliaMontenegroMoroccoMozambiqueMyanmarNamibiaNepalNetherlandsNew CaledoniaNew ZealandNicaraguaNigerNigeriaNorth AmericaNorwayOECD membersOmanOther small statesPacific island small statesPakistanPanamaPapua New GuineaParaguayPeruPhilippinesPolandPortugalPost-demographic dividendPre-demographic dividendQatarRomaniaRussian FederationRwandaSamoaSao Tome and PrincipeSaudi ArabiaSenegalSerbiaSeychellesSierra LeoneSingaporeSlovak RepublicSloveniaSmall statesSolomon IslandsSouth AfricaSouth AsiaSouth Asia (IDA & IBRD)South SudanSpainSri LankaSt. LuciaSt. Vincent and the GrenadinesSub-Saharan Africa Sub-Saharan Africa (excluding high income)Sub-Saharan Africa (IDA & IBRD countries)SudanSurinameSwazilandSwedenSwitzerlandSyrian Arab RepublicTajikistanTanzaniaThailandTimor-LesteTogoTongaTrinidad and TobagoTunisiaTurkeyTurkmenistanUgandaUkraineUnited Arab EmiratesUnited KingdomUnited StatesUpper middle incomeUruguayUzbekistanVanuatuVenezuela, RBVietnamWorldYemen, Rep.ZambiaZimbabwe Timeline:
This timeline shows a graph from 1971 to 2016 of Middle East & North Africa (excluding high income). No data until 1970. Number of actual observations by date: 46.
Source name:
World Development Indicators
Source organization:
Estimates based on sources and methods described in "The Changing Wealth of Nations: Measuring Sustainable Development in the New Millennium" (World Bank, 2011).
Categories, topics:
Energy & Mining, Environment
Last updated:
apr 23, 2017
Indicators value changes by year
Maximum:
36.351
jan 1, 1980
At the date of observation
Value
Absolute change
Change from previous value
jan 1, 1971
0.435
+0.435
0.0%
jan 1, 1972
0.595
+0.16
36.76%
jan 1, 1973
0.364
-0.231
-38.78%
jan 1, 1974
0.534
+0.17
46.65%
jan 1, 1975
23.796
+23.262
4.36K%
jan 1, 1976
19.704
-4.091
-17.19%
jan 1, 1977
19.536
-0.168
-0.85%
jan 1, 1978
18.968
-0.568
-2.91%
jan 1, 1979
18.132
-0.836
-4.41%
jan 1, 1980
36.351
+18.218
100.47%
jan 1, 1981
25.293
-11.058
-30.42%
jan 1, 1982
14.319
-10.974
-43.39%
jan 1, 1983
12.892
-1.427
-9.96%
jan 1, 1984
12.27
-0.622
-4.83%
jan 1, 1985
11.481
-0.789
-6.43%
jan 1, 1986
11.058
-0.423
-3.68%
jan 1, 1987
4.302
-6.756
-61.1%
jan 1, 1988
8.719
+4.417
102.69%
jan 1, 1989
8.297
-0.422
-4.84%
jan 1, 1990
13.408
+5.111
61.59%
jan 1, 1991
14.373
+0.965
7.2%
jan 1, 1992
10.478
-3.895
-27.1%
jan 1, 1993
9.493
-0.985
-9.4%
jan 1, 1994
12.951
+3.459
36.43%
jan 1, 1995
11.38
-1.571
-12.13%
jan 1, 1996
11.372
-0.008
-0.07%
jan 1, 1997
12.728
+1.355
11.92%
jan 1, 1998
11.181
-1.546
-12.15%
jan 1, 1999
6.467
-4.715
-42.17%
jan 1, 2000
9.501
+3.035
46.93%
jan 1, 2001
16.732
+7.231
76.1%
jan 1, 2002
13.157
-3.575
-21.37%
jan 1, 2003
13.815
+0.659
5.01%
jan 1, 2004
15.682
+1.867
13.51%
jan 1, 2005
21.333
+5.651
36.04%
jan 1, 2006
27.404
+6.071
28.46%
jan 1, 2007
29.013
+1.609
5.87%
jan 1, 2008
26.001
-3.011
-10.38%
jan 1, 2009
29.99
+3.989
15.34%
jan 1, 2010
17.686
-12.304
-41.03%
jan 1, 2011
20.633
+2.947
16.66%
jan 1, 2012
23.836
+3.204
15.53%
jan 1, 2013
20.406
-3.43
-14.39%
jan 1, 2014
19.788
-0.618
-3.03%
jan 1, 2015
18.818
-0.971
-4.91%
jan 1, 2016
9.455
-9.362
-49.75%
Ranking of countries by current statistics by years


Comments: