29
/
en
AIzaSyAYiBZKx7MnpbEhh9jyipgxe19OcubqV5w
April 1, 2024
207534
Nepal
NPL
true
2
1
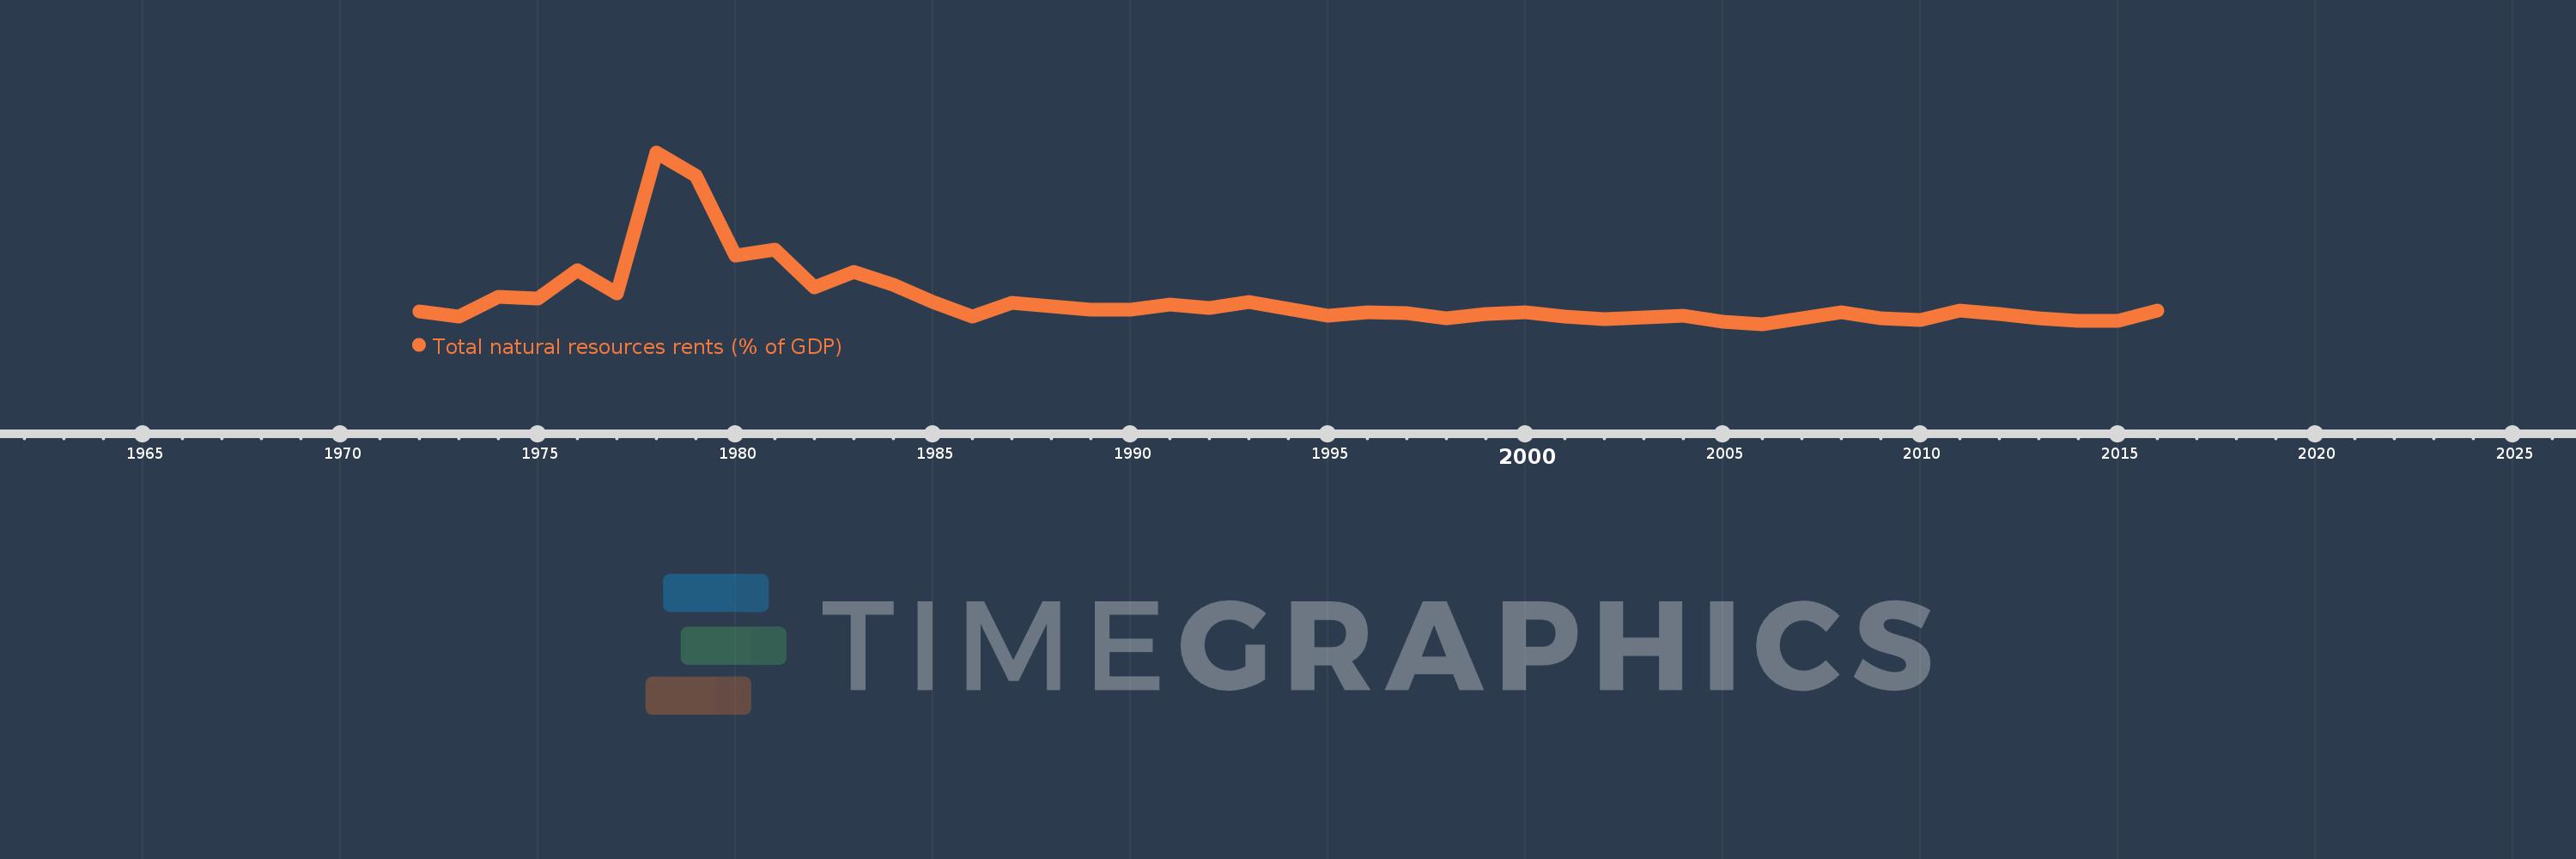
Total natural resources rents (% of GDP)
2016,2015,2014,2013,2012,2011,2010,2009,2008,2007,2006,2005,2004,2003,2002,2001,2000,1999,1998,1997,1996,1995,1994,1993,1992,1991,1990,1989,1988,1987,1986,1985,1984,1983,1982,1981,1980,1979,1978,1977,1976,1975,1974,1973,1972
This statistics in other country:
AfghanistanAlbaniaAlgeriaAngolaArab WorldArgentinaArmeniaArubaAustraliaAustriaAzerbaijanBahamas, TheBahrainBangladeshBarbadosBelarusBelgiumBelizeBeninBhutanBoliviaBosnia and HerzegovinaBotswanaBrazilBrunei DarussalamBulgariaBurkina FasoBurundiCabo VerdeCambodiaCameroonCanadaCaribbean small statesCentral African RepublicCentral Europe and the BalticsChadChileChinaColombiaComorosCongo, Dem. Rep.Congo, Rep.Costa RicaCote d'IvoireCroatiaCubaCyprusCzech RepublicDenmarkDjiboutiDominicaDominican RepublicEarly-demographic dividendEast Asia & PacificEast Asia & Pacific (excluding high income)East Asia & Pacific (IDA & IBRD countries)EcuadorEgypt, Arab Rep.El SalvadorEquatorial GuineaEritreaEstoniaEthiopiaEuro areaEurope & Central AsiaEurope & Central Asia (excluding high income)Europe & Central Asia (IDA & IBRD countries)European UnionFijiFinlandFragile and conflict affected situationsFranceFrench PolynesiaGabonGambia, TheGeorgiaGermanyGhanaGreeceGuatemalaGuineaGuinea-BissauGuyanaHaitiHeavily indebted poor countries (HIPC)High incomeHondurasHong Kong SAR, ChinaHungaryIBRD onlyIcelandIDA & IBRD totalIDA blendIDA onlyIDA totalIndiaIndonesiaIran, Islamic Rep.IraqIrelandIsraelItalyJamaicaJapanJordanKazakhstanKenyaKiribatiKorea, Rep.KuwaitKyrgyz RepublicLao PDRLate-demographic dividendLatin America & Caribbean Latin America & Caribbean (excluding high income)Latin America & the Caribbean (IDA & IBRD countries)LatviaLeast developed countries: UN classificationLebanonLesothoLiberiaLibyaLithuaniaLow & middle incomeLow incomeLower middle incomeLuxembourgMacao SAR, ChinaMacedonia, FYRMadagascarMalawiMalaysiaMaldivesMaliMaltaMauritaniaMauritiusMexicoMiddle East & North AfricaMiddle East & North Africa (excluding high income)Middle East & North Africa (IDA & IBRD countries)Middle incomeMoldovaMongoliaMontenegroMoroccoMozambiqueMyanmarNamibiaNepalNetherlandsNew CaledoniaNew ZealandNicaraguaNigerNigeriaNorth AmericaNorwayOECD membersOmanOther small statesPacific island small statesPakistanPanamaPapua New GuineaParaguayPeruPhilippinesPolandPortugalPost-demographic dividendPre-demographic dividendQatarRomaniaRussian FederationRwandaSamoaSao Tome and PrincipeSaudi ArabiaSenegalSerbiaSeychellesSierra LeoneSingaporeSlovak RepublicSloveniaSmall statesSolomon IslandsSouth AfricaSouth AsiaSouth Asia (IDA & IBRD)South SudanSpainSri LankaSt. LuciaSt. Vincent and the GrenadinesSub-Saharan Africa Sub-Saharan Africa (excluding high income)Sub-Saharan Africa (IDA & IBRD countries)SudanSurinameSwazilandSwedenSwitzerlandSyrian Arab RepublicTajikistanTanzaniaThailandTimor-LesteTogoTongaTrinidad and TobagoTunisiaTurkeyTurkmenistanUgandaUkraineUnited Arab EmiratesUnited KingdomUnited StatesUpper middle incomeUruguayUzbekistanVanuatuVenezuela, RBVietnamWorldYemen, Rep.ZambiaZimbabwe Timeline:
This timeline shows a graph from 1972 to 2016 of Nepal. No data until 1971. Number of actual observations by date: 45.
Source name:
World Development Indicators
Source organization:
Estimates based on sources and methods described in "The Changing Wealth of Nations: Measuring Sustainable Development in the New Millennium" (World Bank, 2011).
Categories, topics:
Energy & Mining, Environment
Last updated:
apr 23, 2017
Indicators value changes by year
At the date of observation
Value
Absolute change
Change from previous value
jan 1, 1972
1.402
+1.402
0.0%
jan 1, 1973
1.175
-0.227
-16.21%
jan 1, 1974
2.113
+0.938
79.86%
jan 1, 1975
2.04
-0.074
-3.48%
jan 1, 1976
3.436
+1.396
68.45%
jan 1, 1977
2.286
-1.15
-33.48%
jan 1, 1978
9.173
+6.887
301.33%
jan 1, 1979
8.055
-1.118
-12.19%
jan 1, 1980
4.152
-3.903
-48.46%
jan 1, 1981
4.443
+0.292
7.03%
jan 1, 1982
2.608
-1.835
-41.3%
jan 1, 1983
3.332
+0.724
27.76%
jan 1, 1984
2.716
-0.616
-18.48%
jan 1, 1985
1.865
-0.851
-31.35%
jan 1, 1986
1.152
-0.712
-38.2%
jan 1, 1987
1.846
+0.694
60.21%
jan 1, 1988
1.68
-0.166
-9.0%
jan 1, 1989
1.522
-0.158
-9.43%
jan 1, 1990
1.489
-0.033
-2.17%
jan 1, 1991
1.747
+0.258
17.33%
jan 1, 1992
1.596
-0.151
-8.62%
jan 1, 1993
1.887
+0.291
18.24%
jan 1, 1994
1.523
-0.364
-19.28%
jan 1, 1995
1.2
-0.323
-21.23%
jan 1, 1996
1.389
+0.189
15.73%
jan 1, 1997
1.326
-0.063
-4.5%
jan 1, 1998
1.091
-0.236
-17.76%
jan 1, 1999
1.272
+0.181
16.6%
jan 1, 2000
1.395
+0.123
9.68%
jan 1, 2001
1.167
-0.228
-16.34%
jan 1, 2002
1.061
-0.106
-9.1%
jan 1, 2003
1.142
+0.081
7.64%
jan 1, 2004
1.21
+0.068
5.99%
jan 1, 2005
0.902
-0.309
-25.5%
jan 1, 2006
0.793
-0.109
-12.08%
jan 1, 2007
1.082
+0.289
36.46%
jan 1, 2008
1.356
+0.274
25.36%
jan 1, 2009
1.074
-0.282
-20.8%
jan 1, 2010
1.005
-0.069
-6.46%
jan 1, 2011
1.471
+0.466
46.38%
jan 1, 2012
1.276
-0.195
-13.24%
jan 1, 2013
1.089
-0.187
-14.68%
jan 1, 2014
0.954
-0.134
-12.33%
jan 1, 2015
0.977
+0.023
2.38%
jan 1, 2016
1.467
+0.49
50.15%
Ranking of countries by current statistics by years


Comments: