29
/
en
AIzaSyAYiBZKx7MnpbEhh9jyipgxe19OcubqV5w
April 1, 2024
254725
Suriname
SUR
true
2
1
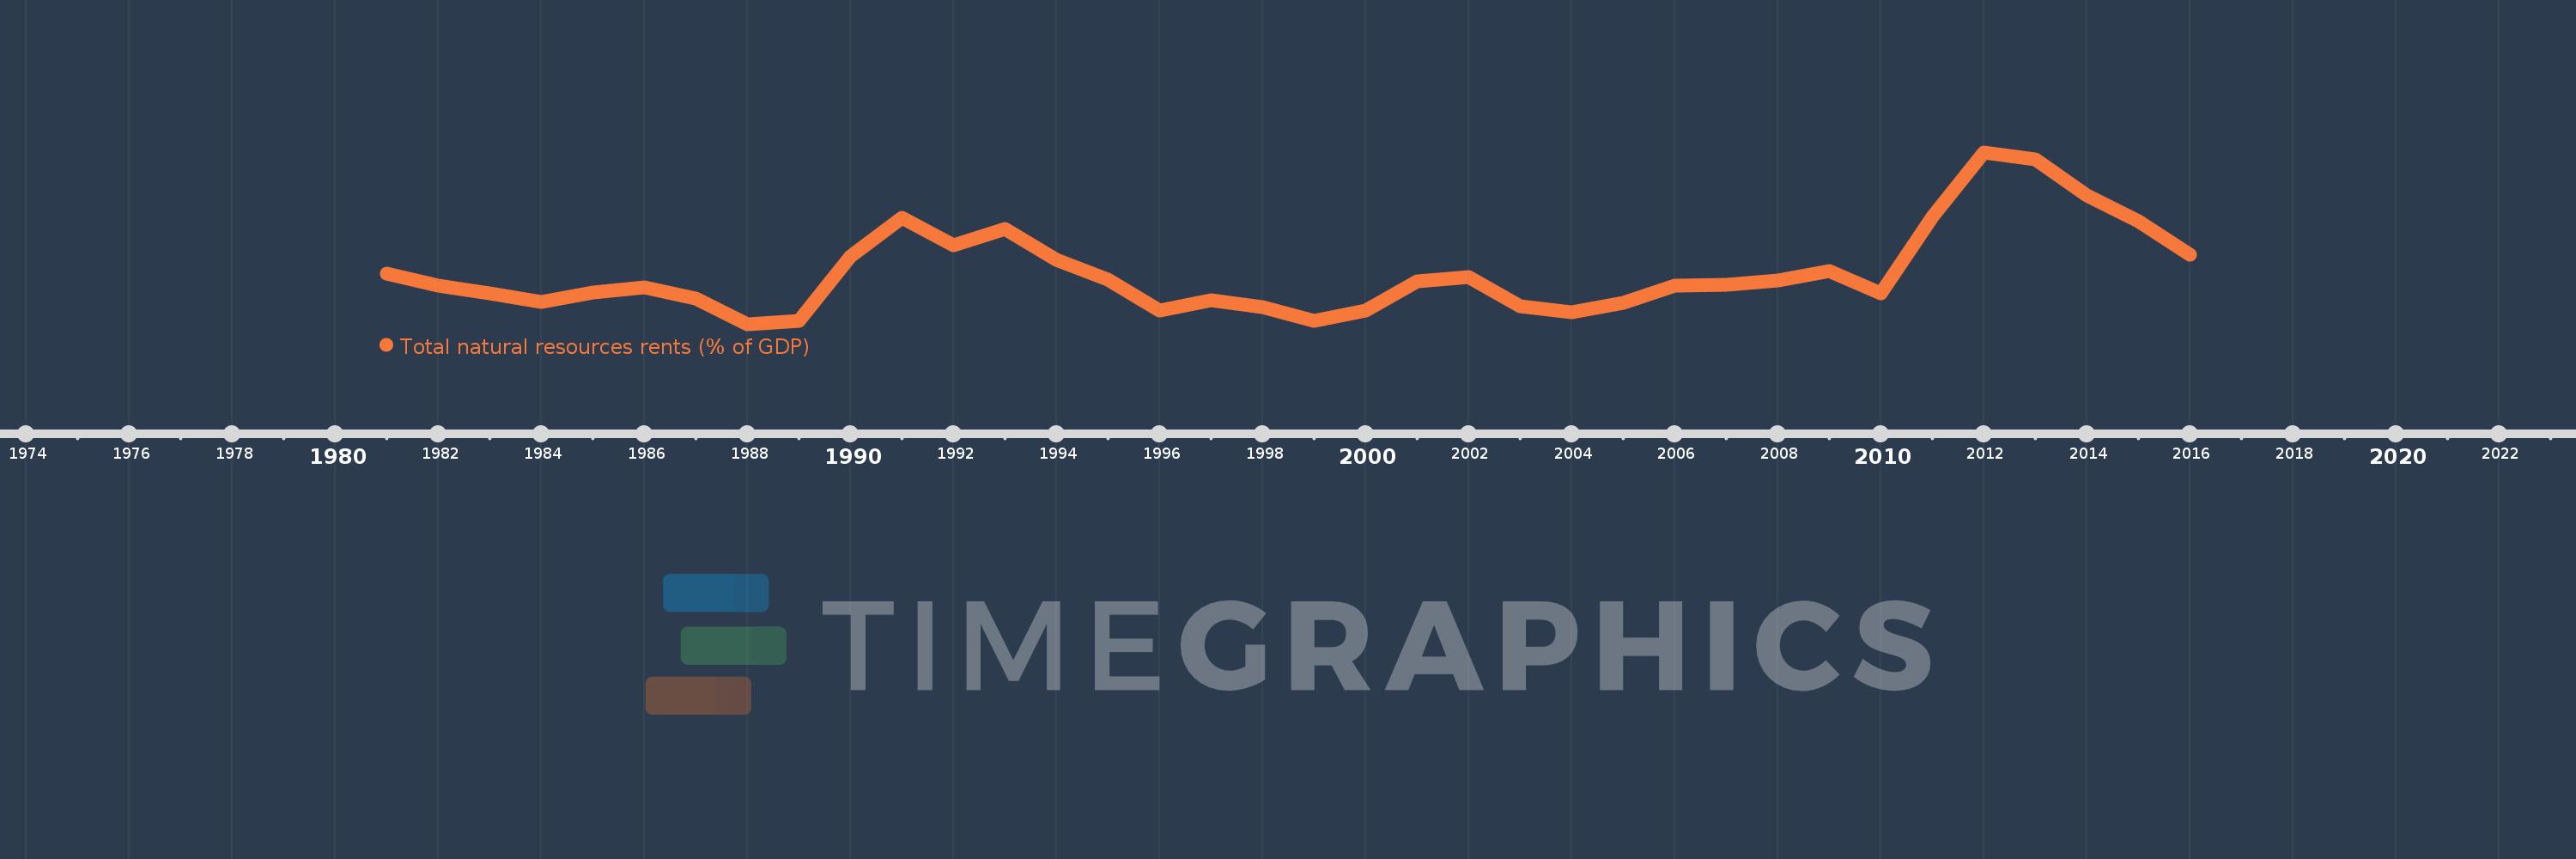
Total natural resources rents (% of GDP)
2016,2015,2014,2013,2012,2011,2010,2009,2008,2007,2006,2005,2004,2003,2002,2001,2000,1999,1998,1997,1996,1995,1994,1993,1992,1991,1990,1989,1988,1987,1986,1985,1984,1983,1982,1981
This statistics in other country:
AfghanistanAlbaniaAlgeriaAngolaArab WorldArgentinaArmeniaArubaAustraliaAustriaAzerbaijanBahamas, TheBahrainBangladeshBarbadosBelarusBelgiumBelizeBeninBhutanBoliviaBosnia and HerzegovinaBotswanaBrazilBrunei DarussalamBulgariaBurkina FasoBurundiCabo VerdeCambodiaCameroonCanadaCaribbean small statesCentral African RepublicCentral Europe and the BalticsChadChileChinaColombiaComorosCongo, Dem. Rep.Congo, Rep.Costa RicaCote d'IvoireCroatiaCubaCyprusCzech RepublicDenmarkDjiboutiDominicaDominican RepublicEarly-demographic dividendEast Asia & PacificEast Asia & Pacific (excluding high income)East Asia & Pacific (IDA & IBRD countries)EcuadorEgypt, Arab Rep.El SalvadorEquatorial GuineaEritreaEstoniaEthiopiaEuro areaEurope & Central AsiaEurope & Central Asia (excluding high income)Europe & Central Asia (IDA & IBRD countries)European UnionFijiFinlandFragile and conflict affected situationsFranceFrench PolynesiaGabonGambia, TheGeorgiaGermanyGhanaGreeceGuatemalaGuineaGuinea-BissauGuyanaHaitiHeavily indebted poor countries (HIPC)High incomeHondurasHong Kong SAR, ChinaHungaryIBRD onlyIcelandIDA & IBRD totalIDA blendIDA onlyIDA totalIndiaIndonesiaIran, Islamic Rep.IraqIrelandIsraelItalyJamaicaJapanJordanKazakhstanKenyaKiribatiKorea, Rep.KuwaitKyrgyz RepublicLao PDRLate-demographic dividendLatin America & Caribbean Latin America & Caribbean (excluding high income)Latin America & the Caribbean (IDA & IBRD countries)LatviaLeast developed countries: UN classificationLebanonLesothoLiberiaLibyaLithuaniaLow & middle incomeLow incomeLower middle incomeLuxembourgMacao SAR, ChinaMacedonia, FYRMadagascarMalawiMalaysiaMaldivesMaliMaltaMauritaniaMauritiusMexicoMiddle East & North AfricaMiddle East & North Africa (excluding high income)Middle East & North Africa (IDA & IBRD countries)Middle incomeMoldovaMongoliaMontenegroMoroccoMozambiqueMyanmarNamibiaNepalNetherlandsNew CaledoniaNew ZealandNicaraguaNigerNigeriaNorth AmericaNorwayOECD membersOmanOther small statesPacific island small statesPakistanPanamaPapua New GuineaParaguayPeruPhilippinesPolandPortugalPost-demographic dividendPre-demographic dividendQatarRomaniaRussian FederationRwandaSamoaSao Tome and PrincipeSaudi ArabiaSenegalSerbiaSeychellesSierra LeoneSingaporeSlovak RepublicSloveniaSmall statesSolomon IslandsSouth AfricaSouth AsiaSouth Asia (IDA & IBRD)South SudanSpainSri LankaSt. LuciaSt. Vincent and the GrenadinesSub-Saharan Africa Sub-Saharan Africa (excluding high income)Sub-Saharan Africa (IDA & IBRD countries)SudanSurinameSwazilandSwedenSwitzerlandSyrian Arab RepublicTajikistanTanzaniaThailandTimor-LesteTogoTongaTrinidad and TobagoTunisiaTurkeyTurkmenistanUgandaUkraineUnited Arab EmiratesUnited KingdomUnited StatesUpper middle incomeUruguayUzbekistanVanuatuVenezuela, RBVietnamWorldYemen, Rep.ZambiaZimbabwe Timeline:
This timeline shows a graph from 1981 to 2016 of Suriname. No data until 1980. Number of actual observations by date: 36.
Source name:
World Development Indicators
Source organization:
Estimates based on sources and methods described in "The Changing Wealth of Nations: Measuring Sustainable Development in the New Millennium" (World Bank, 2011).
Categories, topics:
Energy & Mining, Environment
Last updated:
apr 23, 2017
Indicators value changes by year
Maximum:
35.586
jan 1, 2012
At the date of observation
Value
Absolute change
Change from previous value
jan 1, 1981
14.401
+14.401
0.0%
jan 1, 1982
12.246
-2.155
-14.96%
jan 1, 1983
10.829
-1.417
-11.57%
jan 1, 1984
9.395
-1.434
-13.24%
jan 1, 1985
11.058
+1.663
17.7%
jan 1, 1986
11.973
+0.915
8.27%
jan 1, 1987
10.025
-1.948
-16.27%
jan 1, 1988
5.486
-4.539
-45.27%
jan 1, 1989
6.034
+0.548
9.99%
jan 1, 1990
17.416
+11.382
188.63%
jan 1, 1991
24.118
+6.702
38.48%
jan 1, 1992
19.294
-4.824
-20.0%
jan 1, 1993
22.245
+2.951
15.29%
jan 1, 1994
16.776
-5.469
-24.59%
jan 1, 1995
13.241
-3.535
-21.07%
jan 1, 1996
7.913
-5.328
-40.24%
jan 1, 1997
9.63
+1.717
21.7%
jan 1, 1998
8.413
-1.218
-12.64%
jan 1, 1999
6.061
-2.352
-27.95%
jan 1, 2000
7.933
+1.872
30.88%
jan 1, 2001
13.055
+5.122
64.57%
jan 1, 2002
13.741
+0.687
5.26%
jan 1, 2003
8.584
-5.157
-37.53%
jan 1, 2004
7.648
-0.937
-10.91%
jan 1, 2005
9.279
+1.631
21.33%
jan 1, 2006
12.311
+3.033
32.69%
jan 1, 2007
12.367
+0.055
0.45%
jan 1, 2008
13.206
+0.84
6.79%
jan 1, 2009
14.794
+1.588
12.02%
jan 1, 2010
10.863
-3.931
-26.57%
jan 1, 2011
24.315
+13.452
123.83%
jan 1, 2012
35.586
+11.271
46.35%
jan 1, 2013
34.412
-1.174
-3.3%
jan 1, 2014
28.06
-6.351
-18.46%
jan 1, 2015
23.603
-4.457
-15.88%
jan 1, 2016
17.684
-5.919
-25.08%
Ranking of countries by current statistics by years


Comments: