29
/
en
AIzaSyAYiBZKx7MnpbEhh9jyipgxe19OcubqV5w
April 1, 2024
172291
Kuwait
KWT
true
2
1
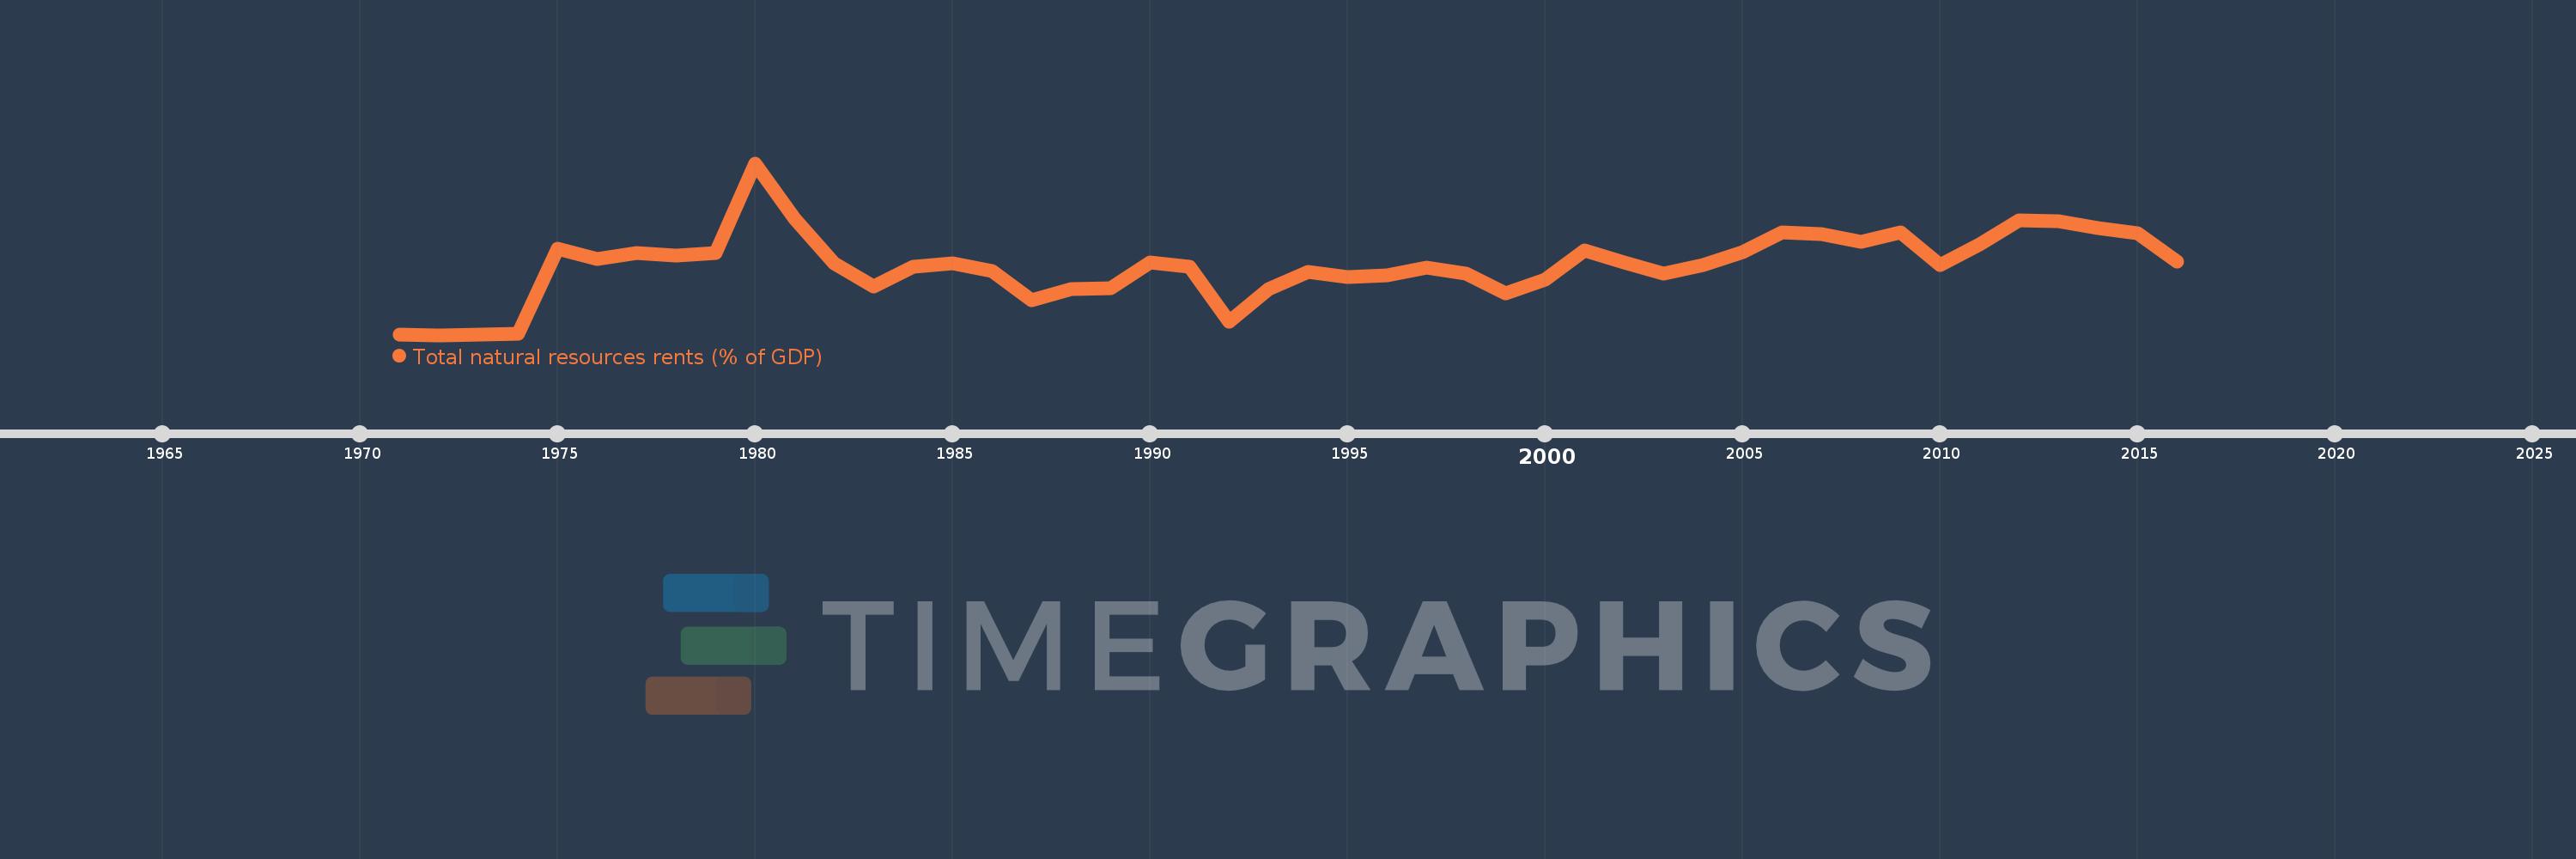
Total natural resources rents (% of GDP)
2016,2015,2014,2013,2012,2011,2010,2009,2008,2007,2006,2005,2004,2003,2002,2001,2000,1999,1998,1997,1996,1995,1994,1993,1992,1991,1990,1989,1988,1987,1986,1985,1984,1983,1982,1981,1980,1979,1978,1977,1976,1975,1974,1973,1972,1971
This statistics in other country:
AfghanistanAlbaniaAlgeriaAngolaArab WorldArgentinaArmeniaArubaAustraliaAustriaAzerbaijanBahamas, TheBahrainBangladeshBarbadosBelarusBelgiumBelizeBeninBhutanBoliviaBosnia and HerzegovinaBotswanaBrazilBrunei DarussalamBulgariaBurkina FasoBurundiCabo VerdeCambodiaCameroonCanadaCaribbean small statesCentral African RepublicCentral Europe and the BalticsChadChileChinaColombiaComorosCongo, Dem. Rep.Congo, Rep.Costa RicaCote d'IvoireCroatiaCubaCyprusCzech RepublicDenmarkDjiboutiDominicaDominican RepublicEarly-demographic dividendEast Asia & PacificEast Asia & Pacific (excluding high income)East Asia & Pacific (IDA & IBRD countries)EcuadorEgypt, Arab Rep.El SalvadorEquatorial GuineaEritreaEstoniaEthiopiaEuro areaEurope & Central AsiaEurope & Central Asia (excluding high income)Europe & Central Asia (IDA & IBRD countries)European UnionFijiFinlandFragile and conflict affected situationsFranceFrench PolynesiaGabonGambia, TheGeorgiaGermanyGhanaGreeceGuatemalaGuineaGuinea-BissauGuyanaHaitiHeavily indebted poor countries (HIPC)High incomeHondurasHong Kong SAR, ChinaHungaryIBRD onlyIcelandIDA & IBRD totalIDA blendIDA onlyIDA totalIndiaIndonesiaIran, Islamic Rep.IraqIrelandIsraelItalyJamaicaJapanJordanKazakhstanKenyaKiribatiKorea, Rep.KuwaitKyrgyz RepublicLao PDRLate-demographic dividendLatin America & Caribbean Latin America & Caribbean (excluding high income)Latin America & the Caribbean (IDA & IBRD countries)LatviaLeast developed countries: UN classificationLebanonLesothoLiberiaLibyaLithuaniaLow & middle incomeLow incomeLower middle incomeLuxembourgMacao SAR, ChinaMacedonia, FYRMadagascarMalawiMalaysiaMaldivesMaliMaltaMauritaniaMauritiusMexicoMiddle East & North AfricaMiddle East & North Africa (excluding high income)Middle East & North Africa (IDA & IBRD countries)Middle incomeMoldovaMongoliaMontenegroMoroccoMozambiqueMyanmarNamibiaNepalNetherlandsNew CaledoniaNew ZealandNicaraguaNigerNigeriaNorth AmericaNorwayOECD membersOmanOther small statesPacific island small statesPakistanPanamaPapua New GuineaParaguayPeruPhilippinesPolandPortugalPost-demographic dividendPre-demographic dividendQatarRomaniaRussian FederationRwandaSamoaSao Tome and PrincipeSaudi ArabiaSenegalSerbiaSeychellesSierra LeoneSingaporeSlovak RepublicSloveniaSmall statesSolomon IslandsSouth AfricaSouth AsiaSouth Asia (IDA & IBRD)South SudanSpainSri LankaSt. LuciaSt. Vincent and the GrenadinesSub-Saharan Africa Sub-Saharan Africa (excluding high income)Sub-Saharan Africa (IDA & IBRD countries)SudanSurinameSwazilandSwedenSwitzerlandSyrian Arab RepublicTajikistanTanzaniaThailandTimor-LesteTogoTongaTrinidad and TobagoTunisiaTurkeyTurkmenistanUgandaUkraineUnited Arab EmiratesUnited KingdomUnited StatesUpper middle incomeUruguayUzbekistanVanuatuVenezuela, RBVietnamWorldYemen, Rep.ZambiaZimbabwe Timeline:
This timeline shows a graph from 1971 to 2016 of Kuwait. No data until 1970. Number of actual observations by date: 46.
Source name:
World Development Indicators
Source organization:
Estimates based on sources and methods described in "The Changing Wealth of Nations: Measuring Sustainable Development in the New Millennium" (World Bank, 2011).
Categories, topics:
Energy & Mining, Environment
Last updated:
apr 23, 2017
Indicators value changes by year
Maximum:
91.395
jan 1, 1980
At the date of observation
Value
Absolute change
Change from previous value
jan 1, 1971
0.226
+0.226
0.0%
jan 1, 1972
0.168
-0.058
-25.54%
jan 1, 1973
0.301
+0.133
78.95%
jan 1, 1974
0.791
+0.49
162.37%
jan 1, 1975
46.026
+45.235
5.72K%
jan 1, 1976
40.333
-5.693
-12.37%
jan 1, 1977
43.66
+3.327
8.25%
jan 1, 1978
42.368
-1.292
-2.96%
jan 1, 1979
43.691
+1.323
3.12%
jan 1, 1980
91.395
+47.703
109.18%
jan 1, 1981
62.074
-29.321
-32.08%
jan 1, 1982
38.039
-24.035
-38.72%
jan 1, 1983
26.139
-11.9
-31.28%
jan 1, 1984
36.461
+10.322
39.49%
jan 1, 1985
38.163
+1.702
4.67%
jan 1, 1986
34.323
-3.84
-10.06%
jan 1, 1987
18.834
-15.489
-45.13%
jan 1, 1988
24.444
+5.61
29.78%
jan 1, 1989
24.899
+0.455
1.86%
jan 1, 1990
38.877
+13.978
56.14%
jan 1, 1991
36.556
-2.321
-5.97%
jan 1, 1992
7.191
-29.365
-80.33%
jan 1, 1993
24.717
+17.526
243.72%
jan 1, 1994
33.834
+9.117
36.89%
jan 1, 1995
31.155
-2.679
-7.92%
jan 1, 1996
31.91
+0.755
2.42%
jan 1, 1997
35.893
+3.983
12.48%
jan 1, 1998
32.999
-2.894
-8.06%
jan 1, 1999
22.356
-10.643
-32.25%
jan 1, 2000
29.649
+7.293
32.62%
jan 1, 2001
45.315
+15.666
52.84%
jan 1, 2002
38.868
-6.447
-14.23%
jan 1, 2003
32.693
-6.174
-15.89%
jan 1, 2004
37.453
+4.759
14.56%
jan 1, 2005
44.121
+6.668
17.8%
jan 1, 2006
54.702
+10.581
23.98%
jan 1, 2007
53.694
-1.007
-1.84%
jan 1, 2008
49.813
-3.881
-7.23%
jan 1, 2009
54.695
+4.882
9.8%
jan 1, 2010
37.385
-17.311
-31.65%
jan 1, 2011
48.402
+11.017
29.47%
jan 1, 2012
60.834
+12.433
25.69%
jan 1, 2013
60.637
-0.198
-0.32%
jan 1, 2014
56.952
-3.684
-6.08%
jan 1, 2015
54.159
-2.793
-4.9%
jan 1, 2016
39.131
-15.028
-27.75%
Ranking of countries by current statistics by years


Comments: