29
/
en
AIzaSyAYiBZKx7MnpbEhh9jyipgxe19OcubqV5w
April 1, 2024
268802
Tunisia
TUN
true
2
1
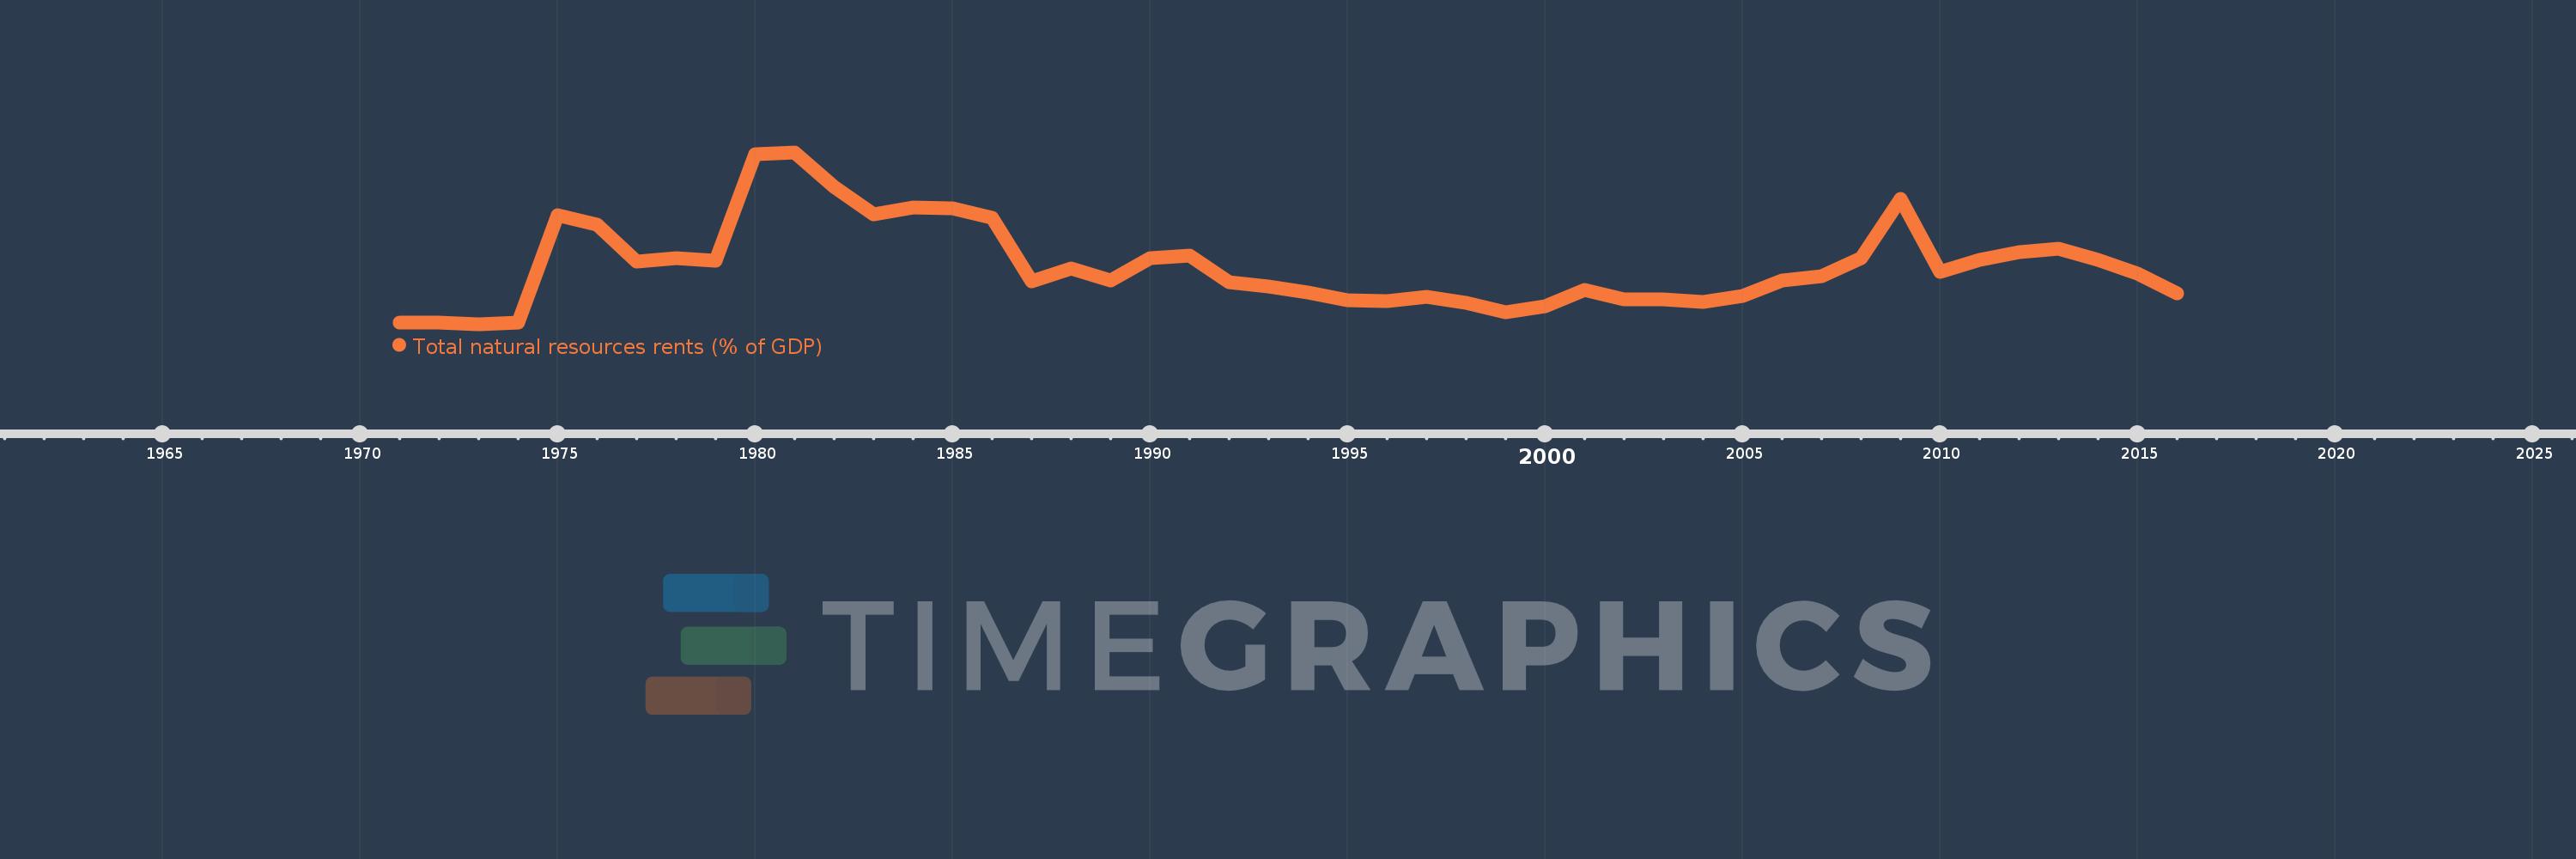
Total natural resources rents (% of GDP)
2016,2015,2014,2013,2012,2011,2010,2009,2008,2007,2006,2005,2004,2003,2002,2001,2000,1999,1998,1997,1996,1995,1994,1993,1992,1991,1990,1989,1988,1987,1986,1985,1984,1983,1982,1981,1980,1979,1978,1977,1976,1975,1974,1973,1972,1971
This statistics in other country:
AfghanistanAlbaniaAlgeriaAngolaArab WorldArgentinaArmeniaArubaAustraliaAustriaAzerbaijanBahamas, TheBahrainBangladeshBarbadosBelarusBelgiumBelizeBeninBhutanBoliviaBosnia and HerzegovinaBotswanaBrazilBrunei DarussalamBulgariaBurkina FasoBurundiCabo VerdeCambodiaCameroonCanadaCaribbean small statesCentral African RepublicCentral Europe and the BalticsChadChileChinaColombiaComorosCongo, Dem. Rep.Congo, Rep.Costa RicaCote d'IvoireCroatiaCubaCyprusCzech RepublicDenmarkDjiboutiDominicaDominican RepublicEarly-demographic dividendEast Asia & PacificEast Asia & Pacific (excluding high income)East Asia & Pacific (IDA & IBRD countries)EcuadorEgypt, Arab Rep.El SalvadorEquatorial GuineaEritreaEstoniaEthiopiaEuro areaEurope & Central AsiaEurope & Central Asia (excluding high income)Europe & Central Asia (IDA & IBRD countries)European UnionFijiFinlandFragile and conflict affected situationsFranceFrench PolynesiaGabonGambia, TheGeorgiaGermanyGhanaGreeceGuatemalaGuineaGuinea-BissauGuyanaHaitiHeavily indebted poor countries (HIPC)High incomeHondurasHong Kong SAR, ChinaHungaryIBRD onlyIcelandIDA & IBRD totalIDA blendIDA onlyIDA totalIndiaIndonesiaIran, Islamic Rep.IraqIrelandIsraelItalyJamaicaJapanJordanKazakhstanKenyaKiribatiKorea, Rep.KuwaitKyrgyz RepublicLao PDRLate-demographic dividendLatin America & Caribbean Latin America & Caribbean (excluding high income)Latin America & the Caribbean (IDA & IBRD countries)LatviaLeast developed countries: UN classificationLebanonLesothoLiberiaLibyaLithuaniaLow & middle incomeLow incomeLower middle incomeLuxembourgMacao SAR, ChinaMacedonia, FYRMadagascarMalawiMalaysiaMaldivesMaliMaltaMauritaniaMauritiusMexicoMiddle East & North AfricaMiddle East & North Africa (excluding high income)Middle East & North Africa (IDA & IBRD countries)Middle incomeMoldovaMongoliaMontenegroMoroccoMozambiqueMyanmarNamibiaNepalNetherlandsNew CaledoniaNew ZealandNicaraguaNigerNigeriaNorth AmericaNorwayOECD membersOmanOther small statesPacific island small statesPakistanPanamaPapua New GuineaParaguayPeruPhilippinesPolandPortugalPost-demographic dividendPre-demographic dividendQatarRomaniaRussian FederationRwandaSamoaSao Tome and PrincipeSaudi ArabiaSenegalSerbiaSeychellesSierra LeoneSingaporeSlovak RepublicSloveniaSmall statesSolomon IslandsSouth AfricaSouth AsiaSouth Asia (IDA & IBRD)South SudanSpainSri LankaSt. LuciaSt. Vincent and the GrenadinesSub-Saharan Africa Sub-Saharan Africa (excluding high income)Sub-Saharan Africa (IDA & IBRD countries)SudanSurinameSwazilandSwedenSwitzerlandSyrian Arab RepublicTajikistanTanzaniaThailandTimor-LesteTogoTongaTrinidad and TobagoTunisiaTurkeyTurkmenistanUgandaUkraineUnited Arab EmiratesUnited KingdomUnited StatesUpper middle incomeUruguayUzbekistanVanuatuVenezuela, RBVietnamWorldYemen, Rep.ZambiaZimbabwe Timeline:
This timeline shows a graph from 1971 to 2016 of Tunisia. No data until 1970. Number of actual observations by date: 46.
Source name:
World Development Indicators
Source organization:
Estimates based on sources and methods described in "The Changing Wealth of Nations: Measuring Sustainable Development in the New Millennium" (World Bank, 2011).
Categories, topics:
Energy & Mining, Environment
Last updated:
apr 23, 2017
Indicators value changes by year
Maximum:
15.214
jan 1, 1981
At the date of observation
Value
Absolute change
Change from previous value
jan 1, 1971
0.499
+0.499
0.0%
jan 1, 1972
0.431
-0.068
-13.56%
jan 1, 1973
0.322
-0.109
-25.24%
jan 1, 1974
0.496
+0.173
53.8%
jan 1, 1975
9.763
+9.268
1.87K%
jan 1, 1976
8.941
-0.822
-8.42%
jan 1, 1977
5.746
-3.195
-35.73%
jan 1, 1978
6.033
+0.287
4.99%
jan 1, 1979
5.847
-0.186
-3.08%
jan 1, 1980
15.039
+9.192
157.2%
jan 1, 1981
15.214
+0.175
1.16%
jan 1, 1982
12.218
-2.996
-19.69%
jan 1, 1983
9.828
-2.391
-19.57%
jan 1, 1984
10.441
+0.613
6.24%
jan 1, 1985
10.402
-0.038
-0.37%
jan 1, 1986
9.565
-0.837
-8.05%
jan 1, 1987
4.006
-5.56
-58.12%
jan 1, 1988
5.182
+1.177
29.38%
jan 1, 1989
4.118
-1.064
-20.53%
jan 1, 1990
6.082
+1.963
47.67%
jan 1, 1991
6.276
+0.194
3.19%
jan 1, 1992
3.929
-2.347
-37.4%
jan 1, 1993
3.601
-0.328
-8.35%
jan 1, 1994
3.06
-0.541
-15.01%
jan 1, 1995
2.41
-0.65
-21.25%
jan 1, 1996
2.31
-0.1
-4.16%
jan 1, 1997
2.699
+0.389
16.84%
jan 1, 1998
2.144
-0.555
-20.56%
jan 1, 1999
1.321
-0.823
-38.39%
jan 1, 2000
1.903
+0.582
44.07%
jan 1, 2001
3.291
+1.387
72.91%
jan 1, 2002
2.492
-0.799
-24.28%
jan 1, 2003
2.475
-0.017
-0.66%
jan 1, 2004
2.28
-0.195
-7.87%
jan 1, 2005
2.782
+0.502
22.02%
jan 1, 2006
4.129
+1.347
48.41%
jan 1, 2007
4.509
+0.38
9.2%
jan 1, 2008
6.053
+1.544
34.23%
jan 1, 2009
11.176
+5.123
84.64%
jan 1, 2010
4.828
-6.347
-56.79%
jan 1, 2011
5.902
+1.073
22.23%
jan 1, 2012
6.558
+0.656
11.11%
jan 1, 2013
6.88
+0.322
4.92%
jan 1, 2014
5.873
-1.007
-14.63%
jan 1, 2015
4.714
-1.159
-19.74%
jan 1, 2016
3.028
-1.686
-35.77%
Ranking of countries by current statistics by years


Comments: