29
/
en
AIzaSyAYiBZKx7MnpbEhh9jyipgxe19OcubqV5w
April 1, 2024
286690
Zambia
ZMB
true
2
1
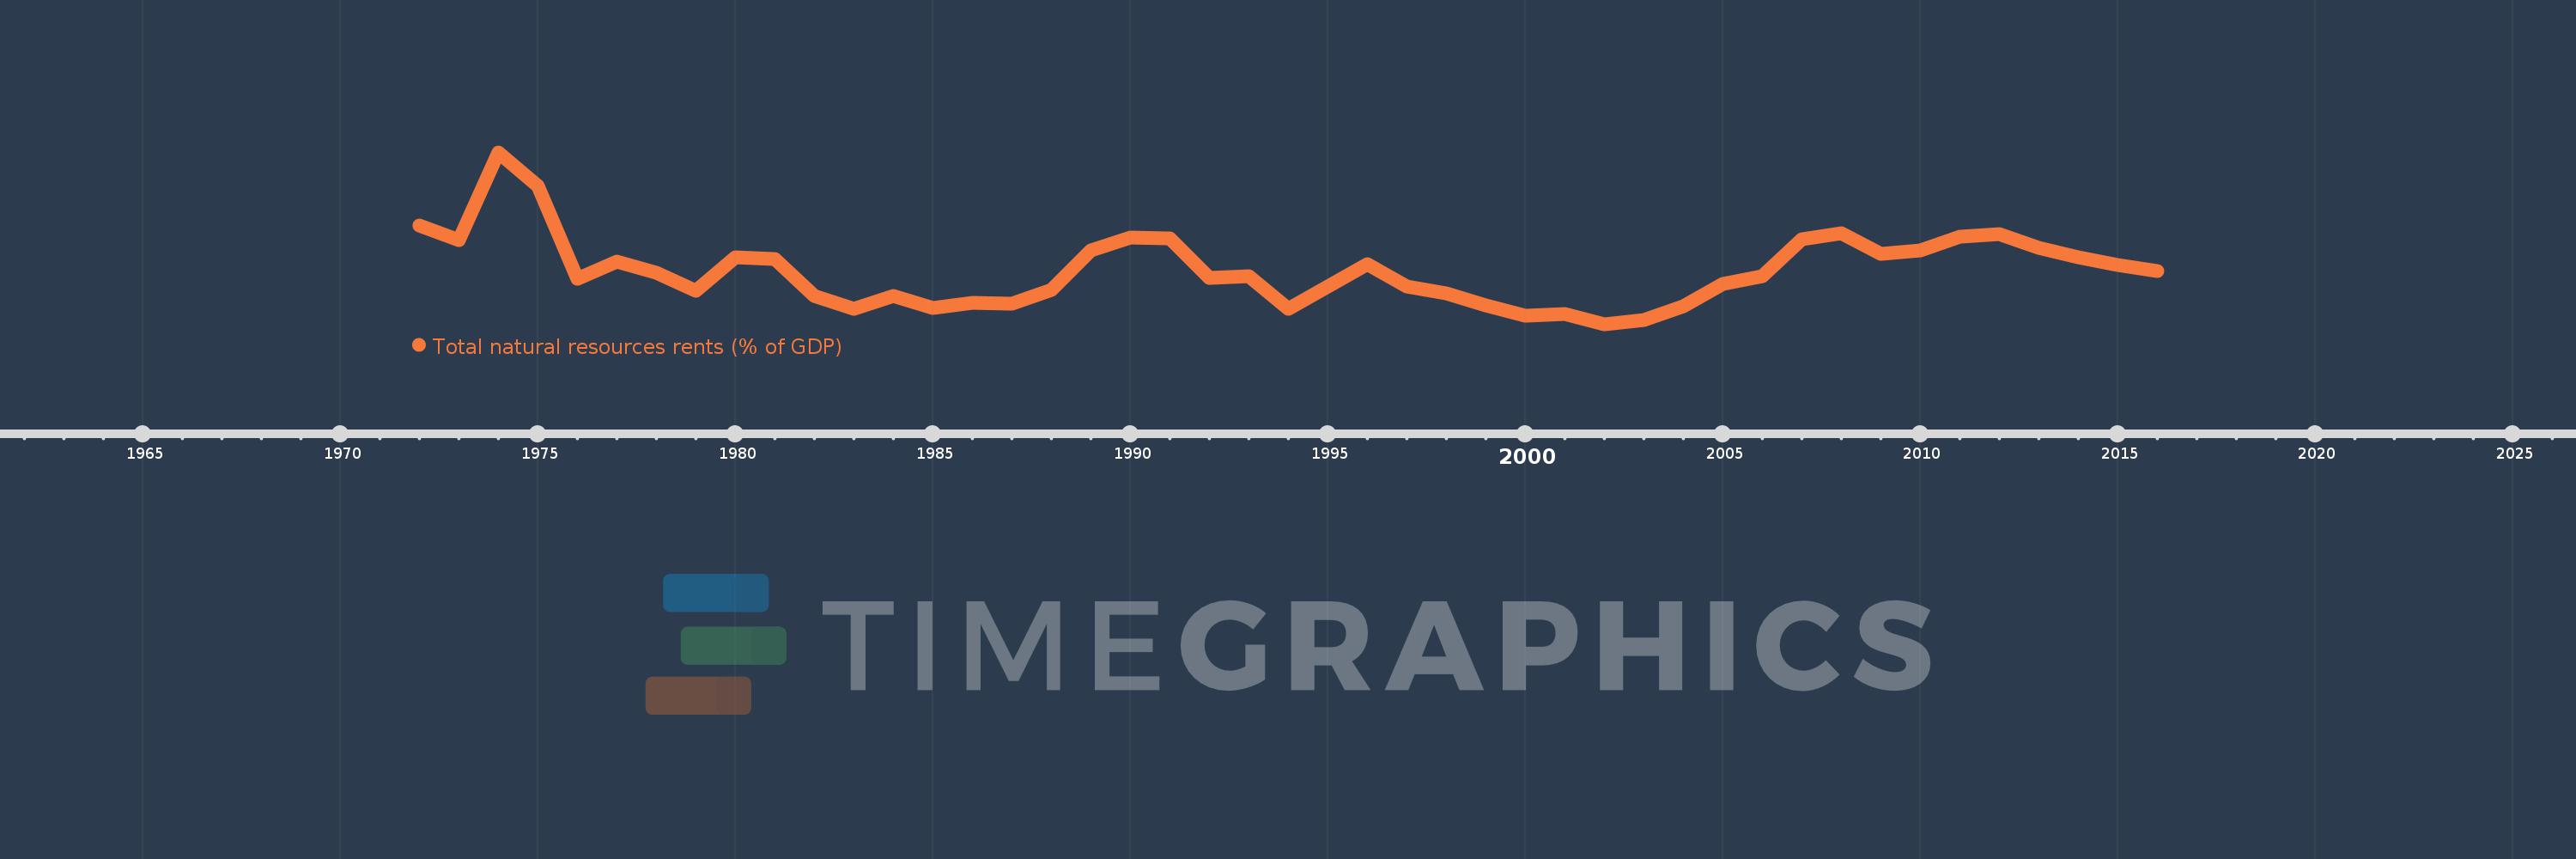
Total natural resources rents (% of GDP)
2016,2015,2014,2013,2012,2011,2010,2009,2008,2007,2006,2005,2004,2003,2002,2001,2000,1999,1998,1997,1996,1995,1994,1993,1992,1991,1990,1989,1988,1987,1986,1985,1984,1983,1982,1981,1980,1979,1978,1977,1976,1975,1974,1973,1972
This statistics in other country:
AfghanistanAlbaniaAlgeriaAngolaArab WorldArgentinaArmeniaArubaAustraliaAustriaAzerbaijanBahamas, TheBahrainBangladeshBarbadosBelarusBelgiumBelizeBeninBhutanBoliviaBosnia and HerzegovinaBotswanaBrazilBrunei DarussalamBulgariaBurkina FasoBurundiCabo VerdeCambodiaCameroonCanadaCaribbean small statesCentral African RepublicCentral Europe and the BalticsChadChileChinaColombiaComorosCongo, Dem. Rep.Congo, Rep.Costa RicaCote d'IvoireCroatiaCubaCyprusCzech RepublicDenmarkDjiboutiDominicaDominican RepublicEarly-demographic dividendEast Asia & PacificEast Asia & Pacific (excluding high income)East Asia & Pacific (IDA & IBRD countries)EcuadorEgypt, Arab Rep.El SalvadorEquatorial GuineaEritreaEstoniaEthiopiaEuro areaEurope & Central AsiaEurope & Central Asia (excluding high income)Europe & Central Asia (IDA & IBRD countries)European UnionFijiFinlandFragile and conflict affected situationsFranceFrench PolynesiaGabonGambia, TheGeorgiaGermanyGhanaGreeceGuatemalaGuineaGuinea-BissauGuyanaHaitiHeavily indebted poor countries (HIPC)High incomeHondurasHong Kong SAR, ChinaHungaryIBRD onlyIcelandIDA & IBRD totalIDA blendIDA onlyIDA totalIndiaIndonesiaIran, Islamic Rep.IraqIrelandIsraelItalyJamaicaJapanJordanKazakhstanKenyaKiribatiKorea, Rep.KuwaitKyrgyz RepublicLao PDRLate-demographic dividendLatin America & Caribbean Latin America & Caribbean (excluding high income)Latin America & the Caribbean (IDA & IBRD countries)LatviaLeast developed countries: UN classificationLebanonLesothoLiberiaLibyaLithuaniaLow & middle incomeLow incomeLower middle incomeLuxembourgMacao SAR, ChinaMacedonia, FYRMadagascarMalawiMalaysiaMaldivesMaliMaltaMauritaniaMauritiusMexicoMiddle East & North AfricaMiddle East & North Africa (excluding high income)Middle East & North Africa (IDA & IBRD countries)Middle incomeMoldovaMongoliaMontenegroMoroccoMozambiqueMyanmarNamibiaNepalNetherlandsNew CaledoniaNew ZealandNicaraguaNigerNigeriaNorth AmericaNorwayOECD membersOmanOther small statesPacific island small statesPakistanPanamaPapua New GuineaParaguayPeruPhilippinesPolandPortugalPost-demographic dividendPre-demographic dividendQatarRomaniaRussian FederationRwandaSamoaSao Tome and PrincipeSaudi ArabiaSenegalSerbiaSeychellesSierra LeoneSingaporeSlovak RepublicSloveniaSmall statesSolomon IslandsSouth AfricaSouth AsiaSouth Asia (IDA & IBRD)South SudanSpainSri LankaSt. LuciaSt. Vincent and the GrenadinesSub-Saharan Africa Sub-Saharan Africa (excluding high income)Sub-Saharan Africa (IDA & IBRD countries)SudanSurinameSwazilandSwedenSwitzerlandSyrian Arab RepublicTajikistanTanzaniaThailandTimor-LesteTogoTongaTrinidad and TobagoTunisiaTurkeyTurkmenistanUgandaUkraineUnited Arab EmiratesUnited KingdomUnited StatesUpper middle incomeUruguayUzbekistanVanuatuVenezuela, RBVietnamWorldYemen, Rep.ZambiaZimbabwe Timeline:
This timeline shows a graph from 1972 to 2016 of Zambia. No data until 1971. Number of actual observations by date: 45.
Source name:
World Development Indicators
Source organization:
Estimates based on sources and methods described in "The Changing Wealth of Nations: Measuring Sustainable Development in the New Millennium" (World Bank, 2011).
Categories, topics:
Energy & Mining, Environment
Last updated:
apr 23, 2017
Indicators value changes by year
Maximum:
38.708
jan 1, 1974
At the date of observation
Value
Absolute change
Change from previous value
jan 1, 1972
23.712
+23.712
0.0%
jan 1, 1973
20.626
-3.086
-13.01%
jan 1, 1974
38.708
+18.082
87.67%
jan 1, 1975
31.758
-6.95
-17.96%
jan 1, 1976
12.751
-19.007
-59.85%
jan 1, 1977
16.231
+3.481
27.3%
jan 1, 1978
13.999
-2.232
-13.75%
jan 1, 1979
10.167
-3.832
-27.37%
jan 1, 1980
17.097
+6.93
68.17%
jan 1, 1981
16.855
-0.242
-1.41%
jan 1, 1982
9.271
-7.584
-44.99%
jan 1, 1983
6.603
-2.668
-28.78%
jan 1, 1984
9.239
+2.636
39.92%
jan 1, 1985
6.647
-2.592
-28.06%
jan 1, 1986
7.862
+1.215
18.28%
jan 1, 1987
7.564
-0.298
-3.79%
jan 1, 1988
10.376
+2.813
37.18%
jan 1, 1989
18.582
+8.205
79.07%
jan 1, 1990
21.145
+2.563
13.79%
jan 1, 1991
20.986
-0.159
-0.75%
jan 1, 1992
12.953
-8.032
-38.28%
jan 1, 1993
13.238
+0.284
2.19%
jan 1, 1994
6.508
-6.729
-50.83%
jan 1, 1995
11.147
+4.638
71.27%
jan 1, 1996
15.654
+4.507
40.44%
jan 1, 1997
11.209
-4.446
-28.4%
jan 1, 1998
9.635
-1.573
-14.04%
jan 1, 1999
7.247
-2.388
-24.79%
jan 1, 2000
5.09
-2.156
-29.76%
jan 1, 2001
5.526
+0.436
8.56%
jan 1, 2002
3.382
-2.144
-38.8%
jan 1, 2003
4.292
+0.91
26.91%
jan 1, 2004
7.038
+2.746
64.0%
jan 1, 2005
11.625
+4.587
65.17%
jan 1, 2006
13.286
+1.661
14.29%
jan 1, 2007
20.801
+7.516
56.57%
jan 1, 2008
22.068
+1.267
6.09%
jan 1, 2009
17.926
-4.142
-18.77%
jan 1, 2010
18.569
+0.643
3.58%
jan 1, 2011
21.387
+2.819
15.18%
jan 1, 2012
21.938
+0.55
2.57%
jan 1, 2013
19.093
-2.844
-12.97%
jan 1, 2014
17.105
-1.989
-10.42%
jan 1, 2015
15.551
-1.553
-9.08%
jan 1, 2016
14.379
-1.172
-7.54%
Ranking of countries by current statistics by years


Comments: