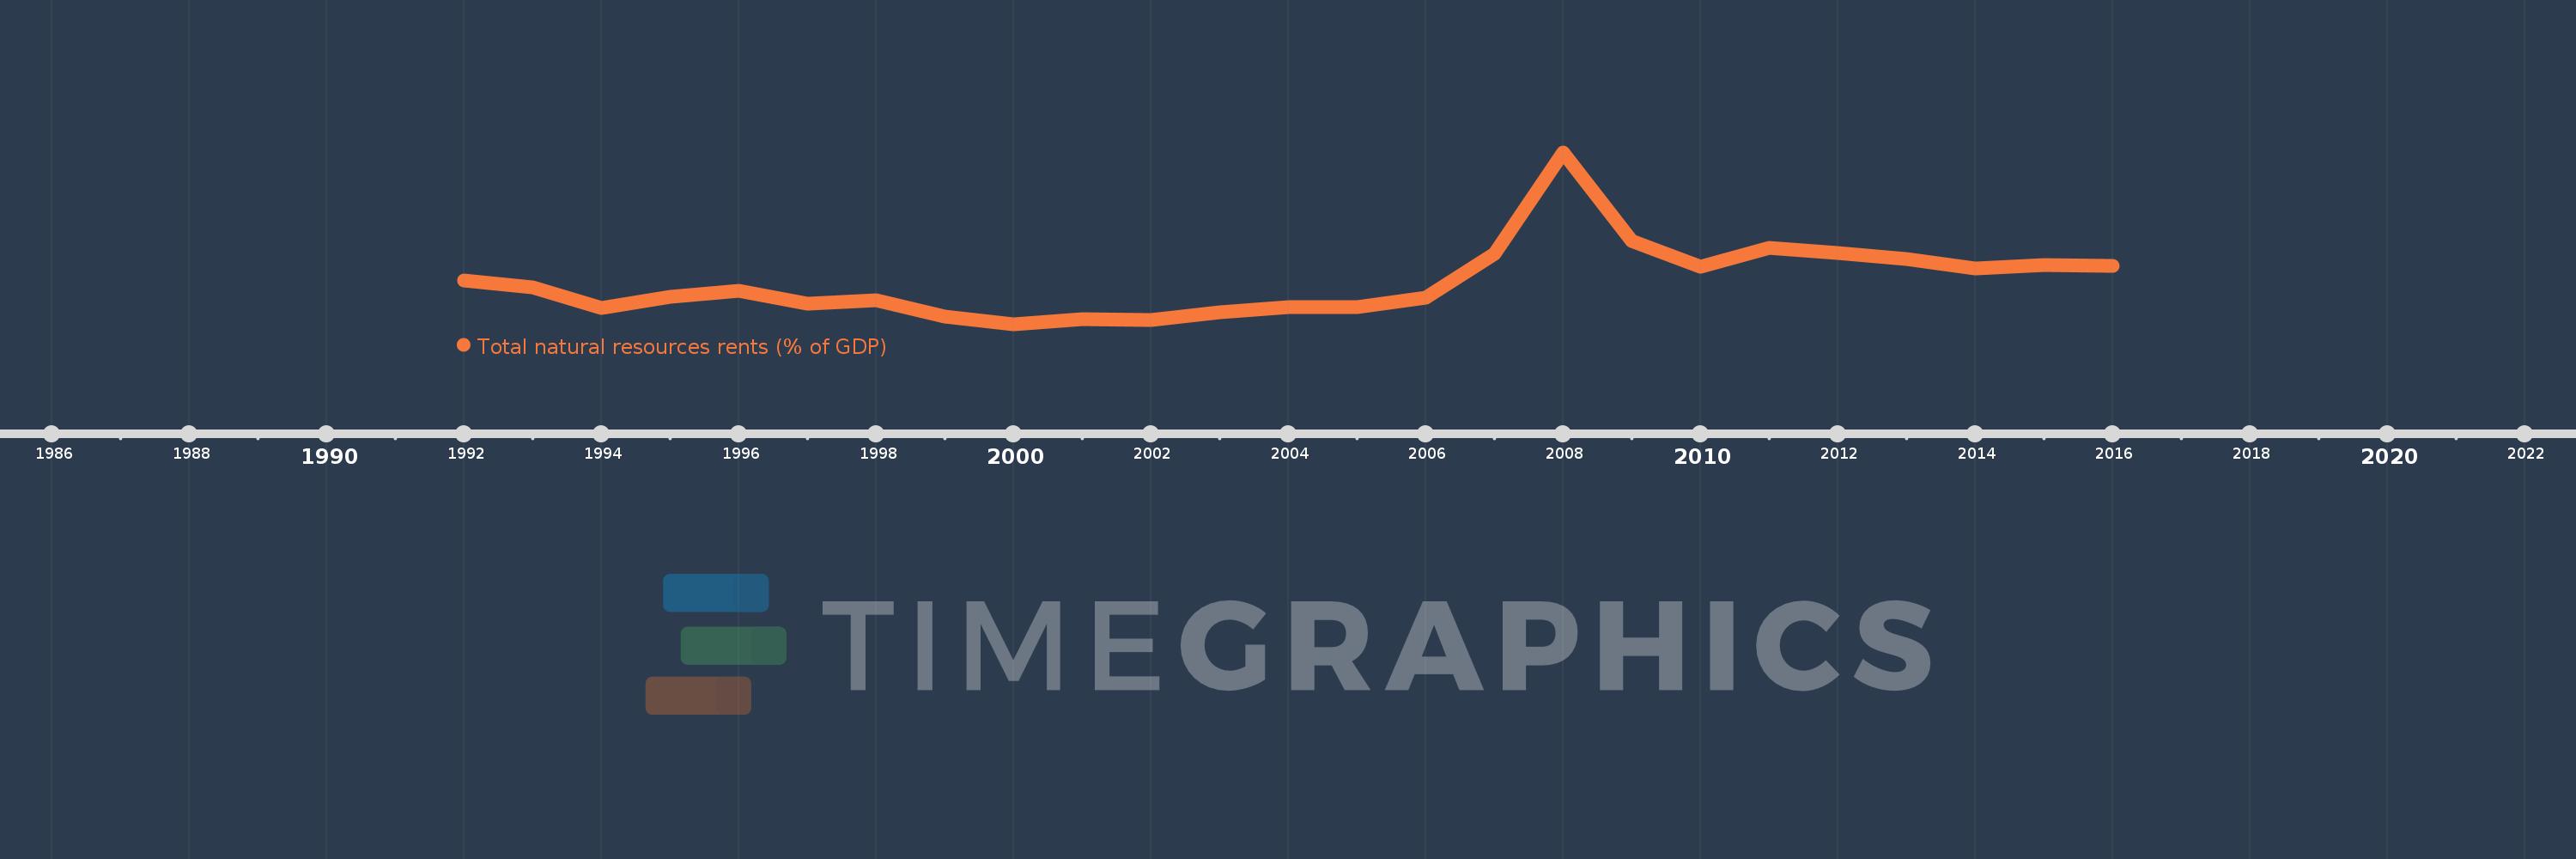
This timeline shows a graph from 1992 to 2016 of Namibia. No data until 1991. Number of actual observations by date: 25.
Source name:
World Development Indicators
Source organization:
Estimates based on sources and methods described in "The Changing Wealth of Nations: Measuring Sustainable Development in the New Millennium" (World Bank, 2011).
Categories, topics:
Energy & Mining, Environment
Last updated:
apr 23, 2017
Indicators value changes by year
Meaning:
1.784
Minimum:
0.374
jan 1, 2000
Maximum:
6.083
jan 1, 2008
At the date of observation
Value
Absolute change
Change from the previous value
jan 1, 1992
1.835
+1.835
0.0%
jan 1, 1993
1.595
-0.24
-13.08%
jan 1, 1994
0.92
-0.675
-42.33%
jan 1, 1995
1.271
+0.351
38.15%
jan 1, 1996
1.478
+0.207
16.32%
jan 1, 1997
1.063
-0.414
-28.04%
jan 1, 1998
1.169
+0.106
9.93%
jan 1, 1999
0.638
-0.531
-45.45%
jan 1, 2000
0.374
-0.264
-41.4%
jan 1, 2001
0.549
+0.175
46.79%
jan 1, 2002
0.525
-0.023
-4.22%
jan 1, 2003
0.775
+0.249
47.46%
jan 1, 2004
0.929
+0.154
19.85%
jan 1, 2005
0.933
+0.005
0.5%
jan 1, 2006
1.267
+0.334
35.79%
jan 1, 2007
2.703
+1.436
113.31%
jan 1, 2008
6.083
+3.379
125.01%
jan 1, 2009
3.128
-2.954
-48.57%
jan 1, 2010
2.285
-0.843
-26.95%
jan 1, 2011
2.899
+0.613
26.84%
jan 1, 2012
2.745
-0.154
-5.31%
jan 1, 2013
2.533
-0.212
-7.73%
jan 1, 2014
2.239
-0.294
-11.6%
jan 1, 2015
2.353
+0.114
5.08%
jan 1, 2016
2.322
-0.031
-1.3%
Ranking of countries by current statistics by years
