29
/
en
AIzaSyAYiBZKx7MnpbEhh9jyipgxe19OcubqV5w
April 1, 2024
111721
Congo, Rep.
COG
true
2
1
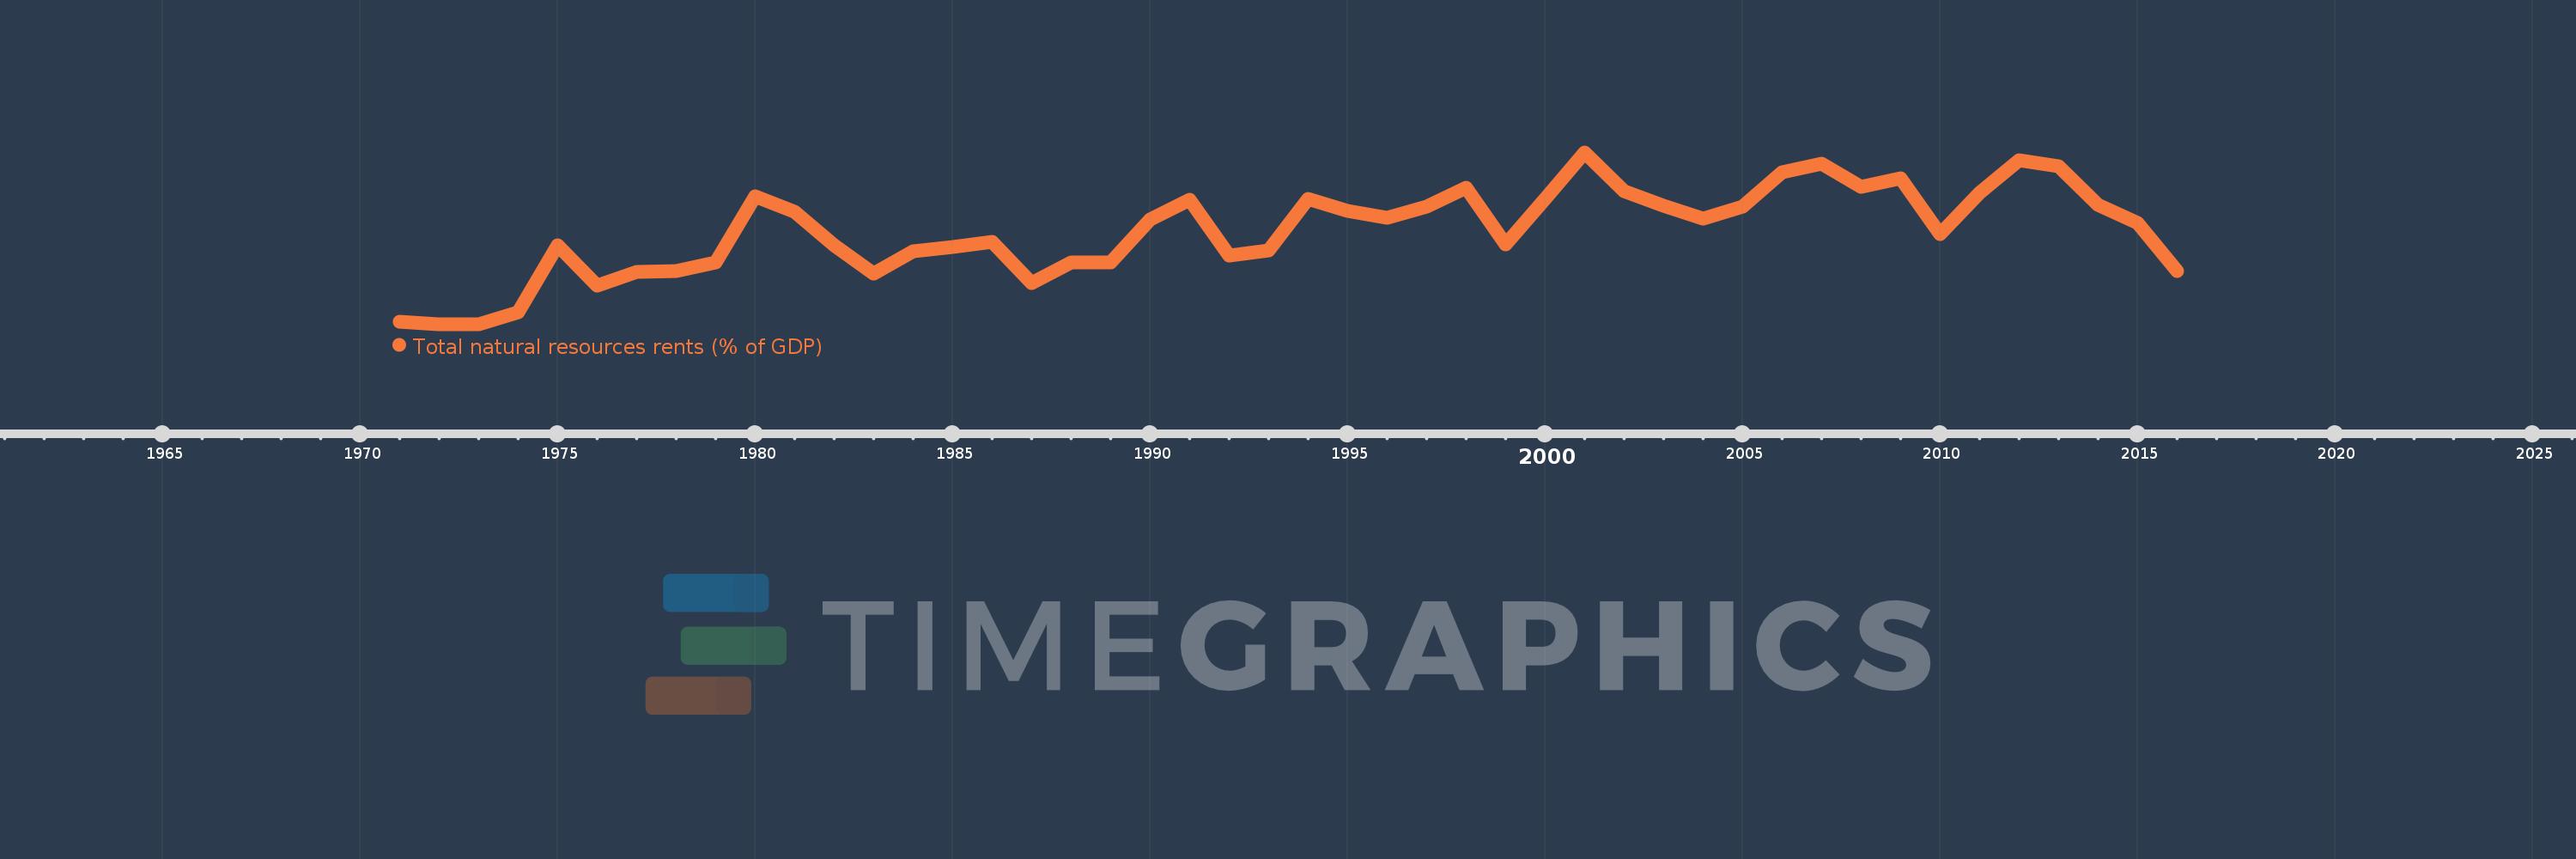
Total natural resources rents (% of GDP)
2016,2015,2014,2013,2012,2011,2010,2009,2008,2007,2006,2005,2004,2003,2002,2001,2000,1999,1998,1997,1996,1995,1994,1993,1992,1991,1990,1989,1988,1987,1986,1985,1984,1983,1982,1981,1980,1979,1978,1977,1976,1975,1974,1973,1972,1971
This statistics in other country:
AfghanistanAlbaniaAlgeriaAngolaArab WorldArgentinaArmeniaArubaAustraliaAustriaAzerbaijanBahamas, TheBahrainBangladeshBarbadosBelarusBelgiumBelizeBeninBhutanBoliviaBosnia and HerzegovinaBotswanaBrazilBrunei DarussalamBulgariaBurkina FasoBurundiCabo VerdeCambodiaCameroonCanadaCaribbean small statesCentral African RepublicCentral Europe and the BalticsChadChileChinaColombiaComorosCongo, Dem. Rep.Congo, Rep.Costa RicaCote d'IvoireCroatiaCubaCyprusCzech RepublicDenmarkDjiboutiDominicaDominican RepublicEarly-demographic dividendEast Asia & PacificEast Asia & Pacific (excluding high income)East Asia & Pacific (IDA & IBRD countries)EcuadorEgypt, Arab Rep.El SalvadorEquatorial GuineaEritreaEstoniaEthiopiaEuro areaEurope & Central AsiaEurope & Central Asia (excluding high income)Europe & Central Asia (IDA & IBRD countries)European UnionFijiFinlandFragile and conflict affected situationsFranceFrench PolynesiaGabonGambia, TheGeorgiaGermanyGhanaGreeceGuatemalaGuineaGuinea-BissauGuyanaHaitiHeavily indebted poor countries (HIPC)High incomeHondurasHong Kong SAR, ChinaHungaryIBRD onlyIcelandIDA & IBRD totalIDA blendIDA onlyIDA totalIndiaIndonesiaIran, Islamic Rep.IraqIrelandIsraelItalyJamaicaJapanJordanKazakhstanKenyaKiribatiKorea, Rep.KuwaitKyrgyz RepublicLao PDRLate-demographic dividendLatin America & Caribbean Latin America & Caribbean (excluding high income)Latin America & the Caribbean (IDA & IBRD countries)LatviaLeast developed countries: UN classificationLebanonLesothoLiberiaLibyaLithuaniaLow & middle incomeLow incomeLower middle incomeLuxembourgMacao SAR, ChinaMacedonia, FYRMadagascarMalawiMalaysiaMaldivesMaliMaltaMauritaniaMauritiusMexicoMiddle East & North AfricaMiddle East & North Africa (excluding high income)Middle East & North Africa (IDA & IBRD countries)Middle incomeMoldovaMongoliaMontenegroMoroccoMozambiqueMyanmarNamibiaNepalNetherlandsNew CaledoniaNew ZealandNicaraguaNigerNigeriaNorth AmericaNorwayOECD membersOmanOther small statesPacific island small statesPakistanPanamaPapua New GuineaParaguayPeruPhilippinesPolandPortugalPost-demographic dividendPre-demographic dividendQatarRomaniaRussian FederationRwandaSamoaSao Tome and PrincipeSaudi ArabiaSenegalSerbiaSeychellesSierra LeoneSingaporeSlovak RepublicSloveniaSmall statesSolomon IslandsSouth AfricaSouth AsiaSouth Asia (IDA & IBRD)South SudanSpainSri LankaSt. LuciaSt. Vincent and the GrenadinesSub-Saharan Africa Sub-Saharan Africa (excluding high income)Sub-Saharan Africa (IDA & IBRD countries)SudanSurinameSwazilandSwedenSwitzerlandSyrian Arab RepublicTajikistanTanzaniaThailandTimor-LesteTogoTongaTrinidad and TobagoTunisiaTurkeyTurkmenistanUgandaUkraineUnited Arab EmiratesUnited KingdomUnited StatesUpper middle incomeUruguayUzbekistanVanuatuVenezuela, RBVietnamWorldYemen, Rep.ZambiaZimbabwe Timeline:
This timeline shows a graph from 1971 to 2016 of Congo, Rep.. No data until 1970. Number of actual observations by date: 46.
Source name:
World Development Indicators
Source organization:
Estimates based on sources and methods described in "The Changing Wealth of Nations: Measuring Sustainable Development in the New Millennium" (World Bank, 2011).
Categories, topics:
Energy & Mining, Environment
Last updated:
apr 23, 2017
Indicators value changes by year
Maximum:
62.576
jan 1, 2001
At the date of observation
Value
Absolute change
Change from previous value
jan 1, 1971
6.633
+6.633
0.0%
jan 1, 1972
5.895
-0.738
-11.13%
jan 1, 1973
5.823
-0.072
-1.23%
jan 1, 1974
9.631
+3.808
65.4%
jan 1, 1975
31.879
+22.248
231.01%
jan 1, 1976
18.47
-13.409
-42.06%
jan 1, 1977
22.975
+4.505
24.39%
jan 1, 1978
23.493
+0.518
2.26%
jan 1, 1979
26.309
+2.816
11.99%
jan 1, 1980
47.96
+21.651
82.29%
jan 1, 1981
43.01
-4.95
-10.32%
jan 1, 1982
31.912
-11.098
-25.8%
jan 1, 1983
22.495
-9.417
-29.51%
jan 1, 1984
29.867
+7.372
32.77%
jan 1, 1985
31.355
+1.488
4.98%
jan 1, 1986
33.035
+1.679
5.36%
jan 1, 1987
19.414
-13.62
-41.23%
jan 1, 1988
26.211
+6.797
35.01%
jan 1, 1989
26.172
-0.039
-0.15%
jan 1, 1990
40.299
+14.127
53.98%
jan 1, 1991
47.008
+6.709
16.65%
jan 1, 1992
28.423
-18.585
-39.54%
jan 1, 1993
30.157
+1.734
6.1%
jan 1, 1994
47.259
+17.103
56.71%
jan 1, 1995
43.223
-4.036
-8.54%
jan 1, 1996
40.976
-2.247
-5.2%
jan 1, 1997
44.8
+3.825
9.33%
jan 1, 1998
50.82
+6.02
13.44%
jan 1, 1999
32.093
-18.727
-36.85%
jan 1, 2000
47.155
+15.062
46.93%
jan 1, 2001
62.576
+15.422
32.7%
jan 1, 2002
49.646
-12.93
-20.66%
jan 1, 2003
45.012
-4.634
-9.33%
jan 1, 2004
40.558
-4.454
-9.9%
jan 1, 2005
44.68
+4.121
10.16%
jan 1, 2006
55.976
+11.297
25.28%
jan 1, 2007
58.785
+2.809
5.02%
jan 1, 2008
51.159
-7.626
-12.97%
jan 1, 2009
53.954
+2.795
5.46%
jan 1, 2010
35.686
-18.268
-33.86%
jan 1, 2011
49.15
+13.465
37.73%
jan 1, 2012
60.131
+10.981
22.34%
jan 1, 2013
57.964
-2.167
-3.6%
jan 1, 2014
45.369
-12.595
-21.73%
jan 1, 2015
39.213
-6.156
-13.57%
jan 1, 2016
23.367
-15.845
-40.41%
Ranking of countries by current statistics by years


Comments: