29
/
en
AIzaSyAYiBZKx7MnpbEhh9jyipgxe19OcubqV5w
April 1, 2024
209860
New Zealand
NZL
true
2
1
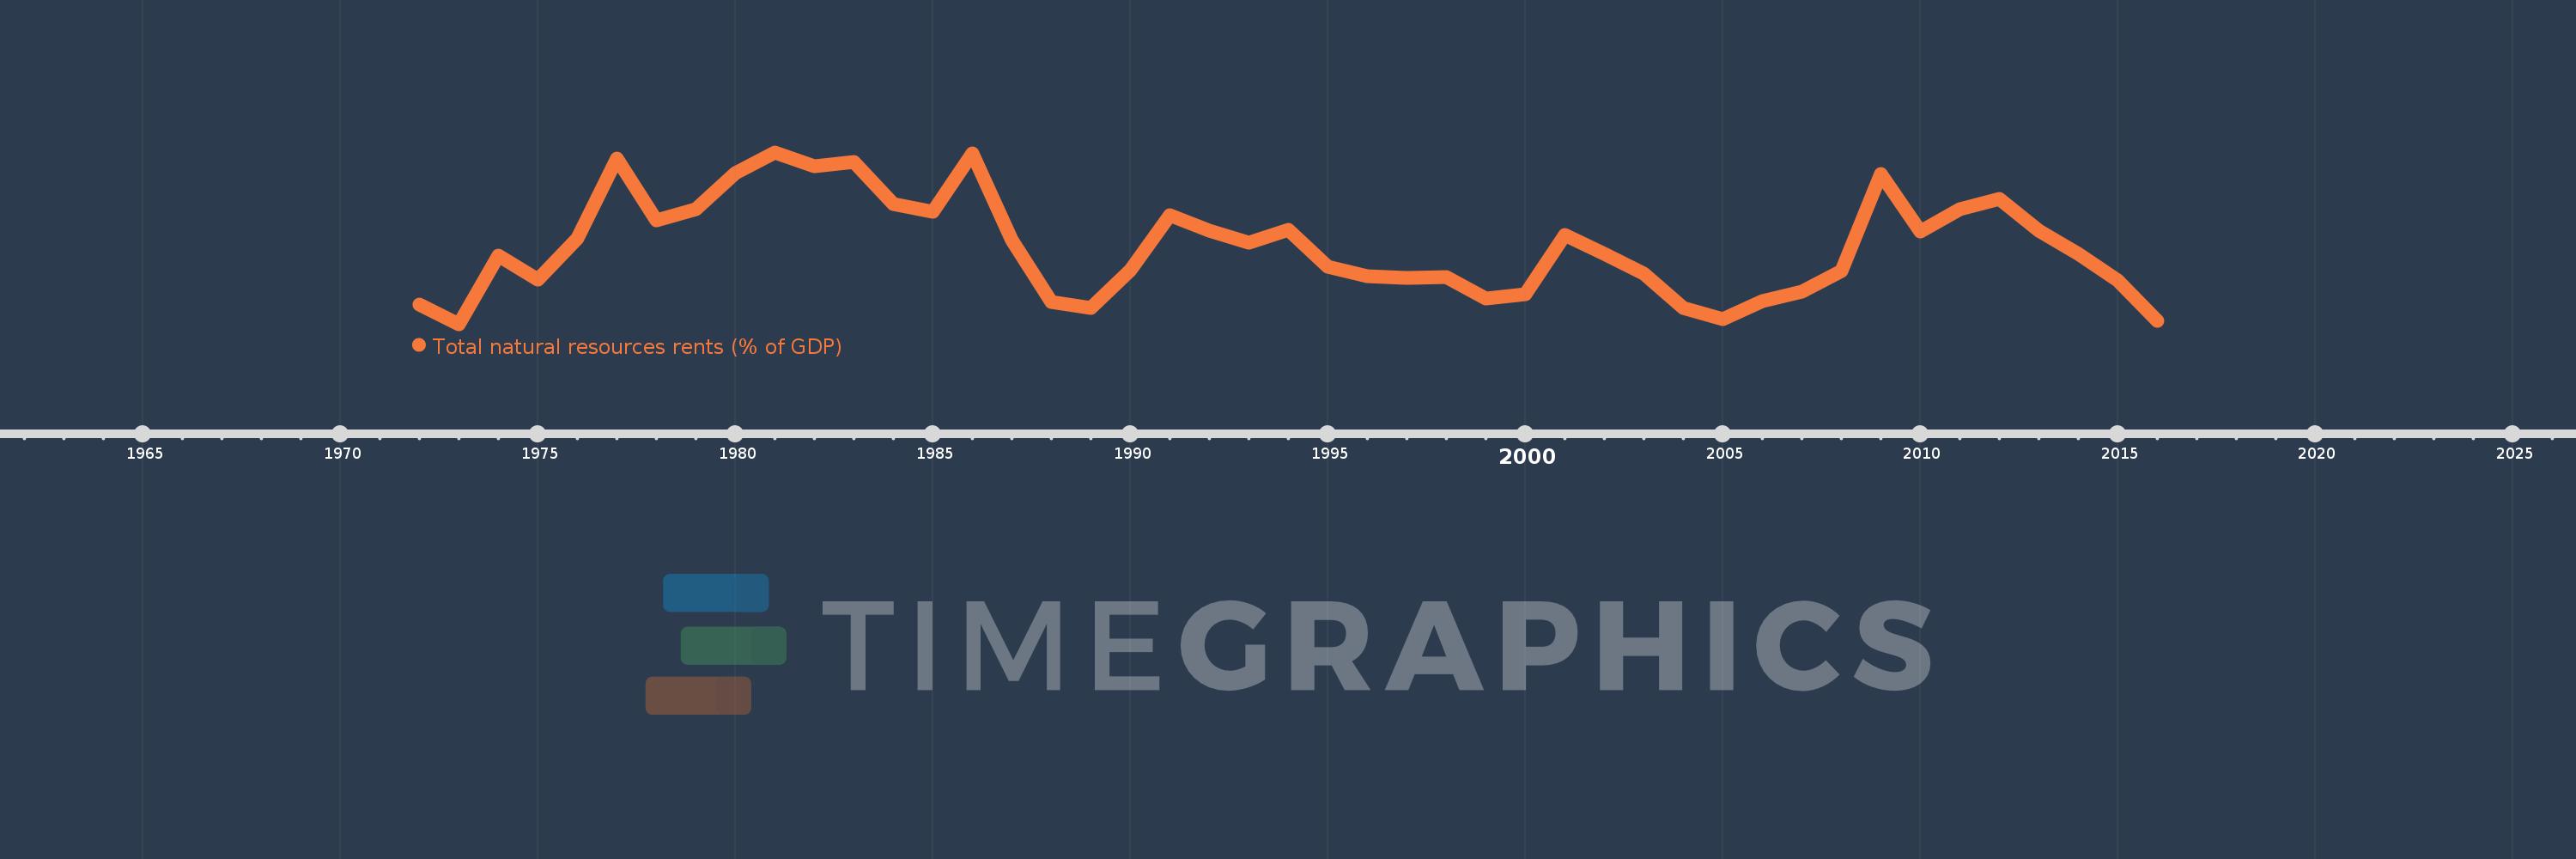
Total natural resources rents (% of GDP)
2016,2015,2014,2013,2012,2011,2010,2009,2008,2007,2006,2005,2004,2003,2002,2001,2000,1999,1998,1997,1996,1995,1994,1993,1992,1991,1990,1989,1988,1987,1986,1985,1984,1983,1982,1981,1980,1979,1978,1977,1976,1975,1974,1973,1972
This statistics in other country:
AfghanistanAlbaniaAlgeriaAngolaArab WorldArgentinaArmeniaArubaAustraliaAustriaAzerbaijanBahamas, TheBahrainBangladeshBarbadosBelarusBelgiumBelizeBeninBhutanBoliviaBosnia and HerzegovinaBotswanaBrazilBrunei DarussalamBulgariaBurkina FasoBurundiCabo VerdeCambodiaCameroonCanadaCaribbean small statesCentral African RepublicCentral Europe and the BalticsChadChileChinaColombiaComorosCongo, Dem. Rep.Congo, Rep.Costa RicaCote d'IvoireCroatiaCubaCyprusCzech RepublicDenmarkDjiboutiDominicaDominican RepublicEarly-demographic dividendEast Asia & PacificEast Asia & Pacific (excluding high income)East Asia & Pacific (IDA & IBRD countries)EcuadorEgypt, Arab Rep.El SalvadorEquatorial GuineaEritreaEstoniaEthiopiaEuro areaEurope & Central AsiaEurope & Central Asia (excluding high income)Europe & Central Asia (IDA & IBRD countries)European UnionFijiFinlandFragile and conflict affected situationsFranceFrench PolynesiaGabonGambia, TheGeorgiaGermanyGhanaGreeceGuatemalaGuineaGuinea-BissauGuyanaHaitiHeavily indebted poor countries (HIPC)High incomeHondurasHong Kong SAR, ChinaHungaryIBRD onlyIcelandIDA & IBRD totalIDA blendIDA onlyIDA totalIndiaIndonesiaIran, Islamic Rep.IraqIrelandIsraelItalyJamaicaJapanJordanKazakhstanKenyaKiribatiKorea, Rep.KuwaitKyrgyz RepublicLao PDRLate-demographic dividendLatin America & Caribbean Latin America & Caribbean (excluding high income)Latin America & the Caribbean (IDA & IBRD countries)LatviaLeast developed countries: UN classificationLebanonLesothoLiberiaLibyaLithuaniaLow & middle incomeLow incomeLower middle incomeLuxembourgMacao SAR, ChinaMacedonia, FYRMadagascarMalawiMalaysiaMaldivesMaliMaltaMauritaniaMauritiusMexicoMiddle East & North AfricaMiddle East & North Africa (excluding high income)Middle East & North Africa (IDA & IBRD countries)Middle incomeMoldovaMongoliaMontenegroMoroccoMozambiqueMyanmarNamibiaNepalNetherlandsNew CaledoniaNew ZealandNicaraguaNigerNigeriaNorth AmericaNorwayOECD membersOmanOther small statesPacific island small statesPakistanPanamaPapua New GuineaParaguayPeruPhilippinesPolandPortugalPost-demographic dividendPre-demographic dividendQatarRomaniaRussian FederationRwandaSamoaSao Tome and PrincipeSaudi ArabiaSenegalSerbiaSeychellesSierra LeoneSingaporeSlovak RepublicSloveniaSmall statesSolomon IslandsSouth AfricaSouth AsiaSouth Asia (IDA & IBRD)South SudanSpainSri LankaSt. LuciaSt. Vincent and the GrenadinesSub-Saharan Africa Sub-Saharan Africa (excluding high income)Sub-Saharan Africa (IDA & IBRD countries)SudanSurinameSwazilandSwedenSwitzerlandSyrian Arab RepublicTajikistanTanzaniaThailandTimor-LesteTogoTongaTrinidad and TobagoTunisiaTurkeyTurkmenistanUgandaUkraineUnited Arab EmiratesUnited KingdomUnited StatesUpper middle incomeUruguayUzbekistanVanuatuVenezuela, RBVietnamWorldYemen, Rep.ZambiaZimbabwe Timeline:
This timeline shows a graph from 1972 to 2016 of New Zealand. No data until 1971. Number of actual observations by date: 45.
Source name:
World Development Indicators
Source organization:
Estimates based on sources and methods described in "The Changing Wealth of Nations: Measuring Sustainable Development in the New Millennium" (World Bank, 2011).
Categories, topics:
Energy & Mining, Environment
Last updated:
apr 23, 2017
Indicators value changes by year
At the date of observation
Value
Absolute change
Change from previous value
jan 1, 1972
1.031
+1.031
0.0%
jan 1, 1973
0.832
-0.199
-19.28%
jan 1, 1974
1.529
+0.697
83.76%
jan 1, 1975
1.287
-0.243
-15.88%
jan 1, 1976
1.708
+0.421
32.73%
jan 1, 1977
2.518
+0.81
47.44%
jan 1, 1978
1.89
-0.628
-24.95%
jan 1, 1979
2.004
+0.114
6.03%
jan 1, 1980
2.372
+0.368
18.36%
jan 1, 1981
2.58
+0.208
8.77%
jan 1, 1982
2.44
-0.14
-5.41%
jan 1, 1983
2.487
+0.047
1.93%
jan 1, 1984
2.056
-0.431
-17.35%
jan 1, 1985
1.976
-0.08
-3.87%
jan 1, 1986
2.572
+0.596
30.16%
jan 1, 1987
1.686
-0.887
-34.47%
jan 1, 1988
1.062
-0.624
-37.02%
jan 1, 1989
0.994
-0.068
-6.4%
jan 1, 1990
1.383
+0.389
39.16%
jan 1, 1991
1.941
+0.559
40.4%
jan 1, 1992
1.788
-0.153
-7.9%
jan 1, 1993
1.659
-0.129
-7.21%
jan 1, 1994
1.794
+0.135
8.13%
jan 1, 1995
1.42
-0.374
-20.83%
jan 1, 1996
1.324
-0.096
-6.79%
jan 1, 1997
1.307
-0.017
-1.27%
jan 1, 1998
1.313
+0.006
0.49%
jan 1, 1999
1.092
-0.221
-16.85%
jan 1, 2000
1.136
+0.044
4.04%
jan 1, 2001
1.738
+0.602
52.97%
jan 1, 2002
1.544
-0.194
-11.14%
jan 1, 2003
1.348
-0.196
-12.71%
jan 1, 2004
0.996
-0.352
-26.11%
jan 1, 2005
0.884
-0.112
-11.28%
jan 1, 2006
1.065
+0.182
20.57%
jan 1, 2007
1.164
+0.098
9.2%
jan 1, 2008
1.371
+0.207
17.83%
jan 1, 2009
2.358
+0.987
72.03%
jan 1, 2010
1.773
-0.586
-24.84%
jan 1, 2011
2.004
+0.231
13.06%
jan 1, 2012
2.11
+0.106
5.28%
jan 1, 2013
1.786
-0.324
-15.33%
jan 1, 2014
1.551
-0.236
-13.2%
jan 1, 2015
1.277
-0.273
-17.62%
jan 1, 2016
0.87
-0.407
-31.88%
Ranking of countries by current statistics by years


Comments: