29
/
en
AIzaSyAYiBZKx7MnpbEhh9jyipgxe19OcubqV5w
April 1, 2024
208529
Netherlands
NLD
true
2
1
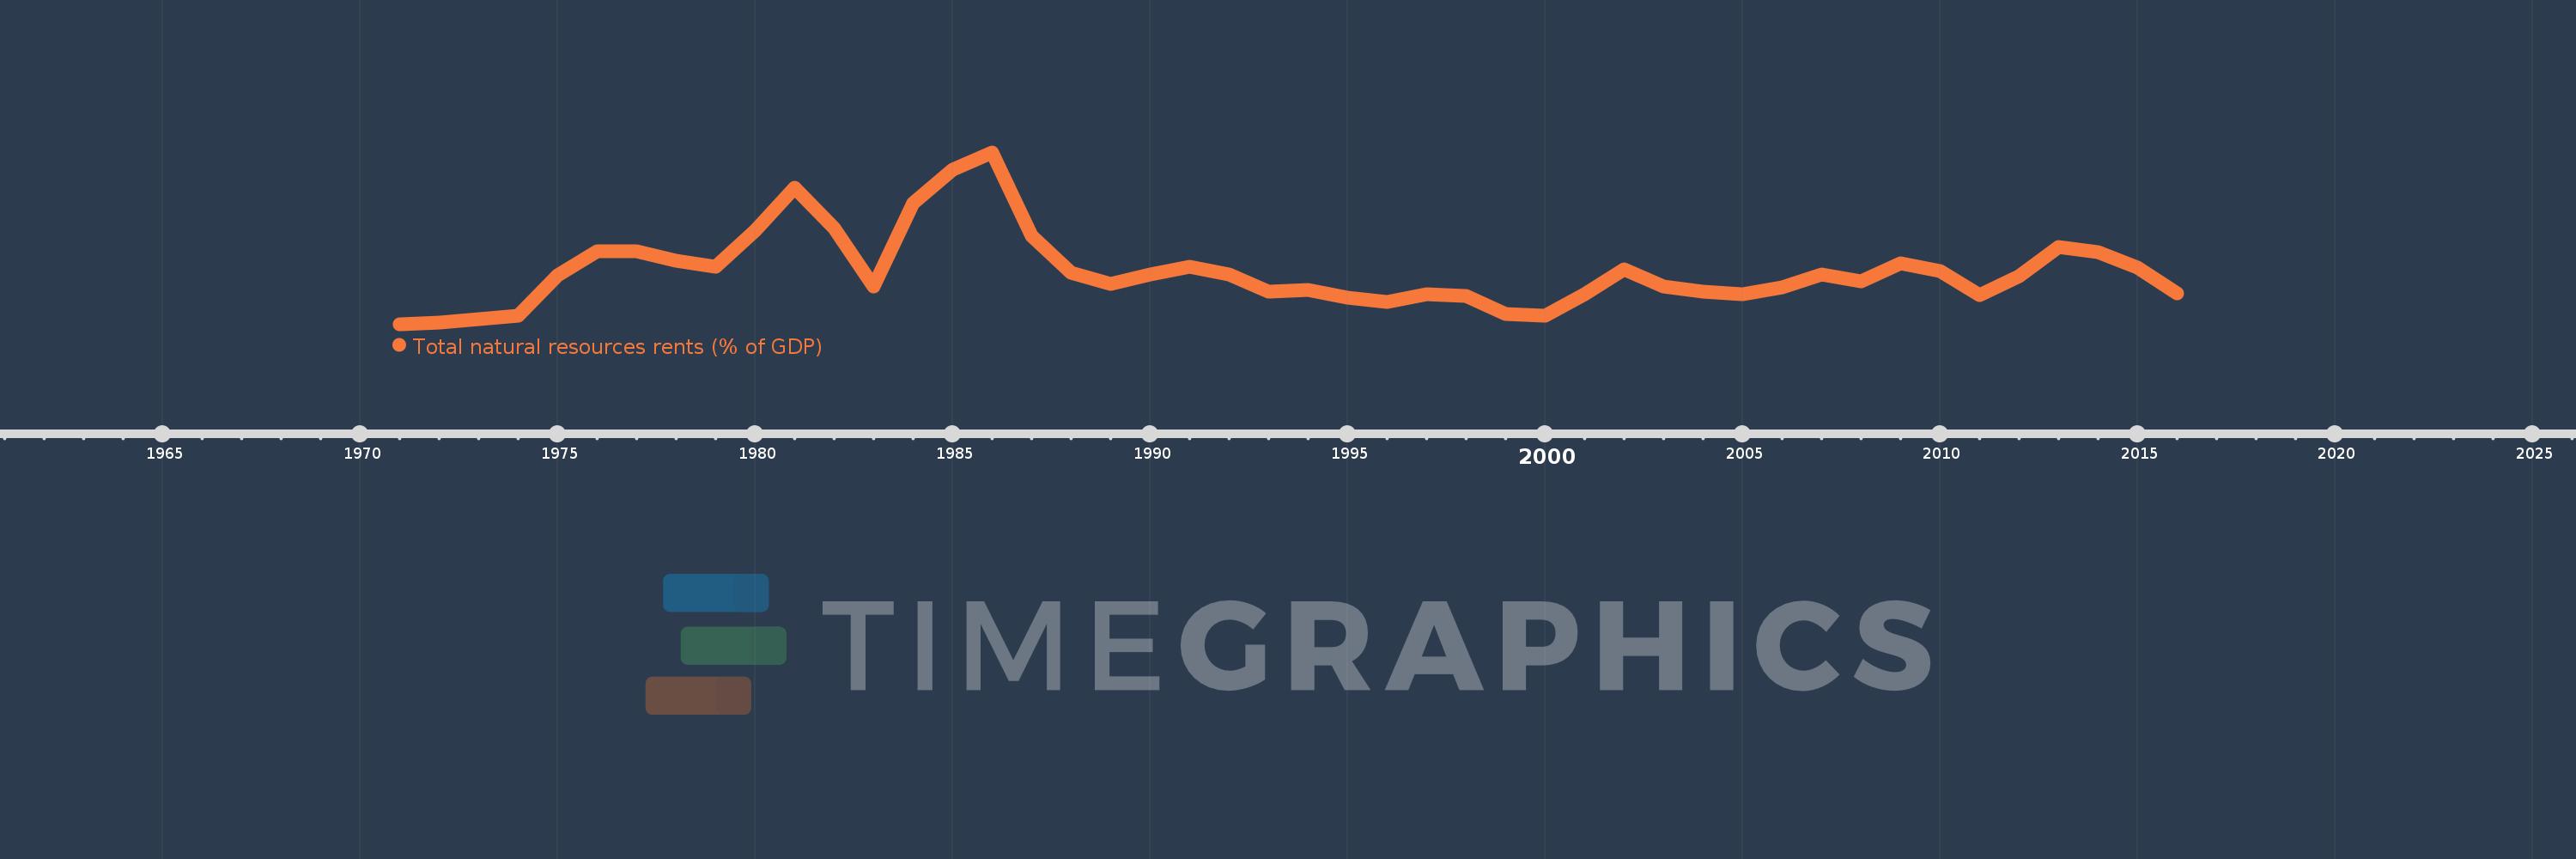
Total natural resources rents (% of GDP)
2016,2015,2014,2013,2012,2011,2010,2009,2008,2007,2006,2005,2004,2003,2002,2001,2000,1999,1998,1997,1996,1995,1994,1993,1992,1991,1990,1989,1988,1987,1986,1985,1984,1983,1982,1981,1980,1979,1978,1977,1976,1975,1974,1973,1972,1971
This statistics in other country:
AfghanistanAlbaniaAlgeriaAngolaArab WorldArgentinaArmeniaArubaAustraliaAustriaAzerbaijanBahamas, TheBahrainBangladeshBarbadosBelarusBelgiumBelizeBeninBhutanBoliviaBosnia and HerzegovinaBotswanaBrazilBrunei DarussalamBulgariaBurkina FasoBurundiCabo VerdeCambodiaCameroonCanadaCaribbean small statesCentral African RepublicCentral Europe and the BalticsChadChileChinaColombiaComorosCongo, Dem. Rep.Congo, Rep.Costa RicaCote d'IvoireCroatiaCubaCyprusCzech RepublicDenmarkDjiboutiDominicaDominican RepublicEarly-demographic dividendEast Asia & PacificEast Asia & Pacific (excluding high income)East Asia & Pacific (IDA & IBRD countries)EcuadorEgypt, Arab Rep.El SalvadorEquatorial GuineaEritreaEstoniaEthiopiaEuro areaEurope & Central AsiaEurope & Central Asia (excluding high income)Europe & Central Asia (IDA & IBRD countries)European UnionFijiFinlandFragile and conflict affected situationsFranceFrench PolynesiaGabonGambia, TheGeorgiaGermanyGhanaGreeceGuatemalaGuineaGuinea-BissauGuyanaHaitiHeavily indebted poor countries (HIPC)High incomeHondurasHong Kong SAR, ChinaHungaryIBRD onlyIcelandIDA & IBRD totalIDA blendIDA onlyIDA totalIndiaIndonesiaIran, Islamic Rep.IraqIrelandIsraelItalyJamaicaJapanJordanKazakhstanKenyaKiribatiKorea, Rep.KuwaitKyrgyz RepublicLao PDRLate-demographic dividendLatin America & Caribbean Latin America & Caribbean (excluding high income)Latin America & the Caribbean (IDA & IBRD countries)LatviaLeast developed countries: UN classificationLebanonLesothoLiberiaLibyaLithuaniaLow & middle incomeLow incomeLower middle incomeLuxembourgMacao SAR, ChinaMacedonia, FYRMadagascarMalawiMalaysiaMaldivesMaliMaltaMauritaniaMauritiusMexicoMiddle East & North AfricaMiddle East & North Africa (excluding high income)Middle East & North Africa (IDA & IBRD countries)Middle incomeMoldovaMongoliaMontenegroMoroccoMozambiqueMyanmarNamibiaNepalNetherlandsNew CaledoniaNew ZealandNicaraguaNigerNigeriaNorth AmericaNorwayOECD membersOmanOther small statesPacific island small statesPakistanPanamaPapua New GuineaParaguayPeruPhilippinesPolandPortugalPost-demographic dividendPre-demographic dividendQatarRomaniaRussian FederationRwandaSamoaSao Tome and PrincipeSaudi ArabiaSenegalSerbiaSeychellesSierra LeoneSingaporeSlovak RepublicSloveniaSmall statesSolomon IslandsSouth AfricaSouth AsiaSouth Asia (IDA & IBRD)South SudanSpainSri LankaSt. LuciaSt. Vincent and the GrenadinesSub-Saharan Africa Sub-Saharan Africa (excluding high income)Sub-Saharan Africa (IDA & IBRD countries)SudanSurinameSwazilandSwedenSwitzerlandSyrian Arab RepublicTajikistanTanzaniaThailandTimor-LesteTogoTongaTrinidad and TobagoTunisiaTurkeyTurkmenistanUgandaUkraineUnited Arab EmiratesUnited KingdomUnited StatesUpper middle incomeUruguayUzbekistanVanuatuVenezuela, RBVietnamWorldYemen, Rep.ZambiaZimbabwe Timeline:
This timeline shows a graph from 1971 to 2016 of Netherlands. No data until 1970. Number of actual observations by date: 46.
Source name:
World Development Indicators
Source organization:
Estimates based on sources and methods described in "The Changing Wealth of Nations: Measuring Sustainable Development in the New Millennium" (World Bank, 2011).
Categories, topics:
Energy & Mining, Environment
Last updated:
apr 23, 2017
Indicators value changes by year
At the date of observation
Value
Absolute change
Change from previous value
jan 1, 1971
0.048
+0.048
0.0%
jan 1, 1972
0.072
+0.024
50.18%
jan 1, 1973
0.129
+0.057
78.95%
jan 1, 1974
0.171
+0.042
32.71%
jan 1, 1975
0.788
+0.618
361.97%
jan 1, 1976
1.139
+0.351
44.55%
jan 1, 1977
1.142
+0.003
0.28%
jan 1, 1978
0.998
-0.144
-12.63%
jan 1, 1979
0.912
-0.086
-8.67%
jan 1, 1980
1.45
+0.538
59.01%
jan 1, 1981
2.093
+0.644
44.39%
jan 1, 1982
1.49
-0.603
-28.81%
jan 1, 1983
0.608
-0.882
-59.18%
jan 1, 1984
1.863
+1.254
206.21%
jan 1, 1985
2.373
+0.51
27.39%
jan 1, 1986
2.627
+0.254
10.69%
jan 1, 1987
1.38
-1.246
-47.45%
jan 1, 1988
0.818
-0.563
-40.75%
jan 1, 1989
0.653
-0.165
-20.21%
jan 1, 1990
0.789
+0.137
20.94%
jan 1, 1991
0.906
+0.117
14.81%
jan 1, 1992
0.789
-0.117
-12.93%
jan 1, 1993
0.531
-0.258
-32.75%
jan 1, 1994
0.562
+0.031
5.86%
jan 1, 1995
0.451
-0.11
-19.64%
jan 1, 1996
0.378
-0.073
-16.23%
jan 1, 1997
0.498
+0.12
31.61%
jan 1, 1998
0.467
-0.031
-6.23%
jan 1, 1999
0.202
-0.265
-56.69%
jan 1, 2000
0.17
-0.032
-15.7%
jan 1, 2001
0.504
+0.334
196.02%
jan 1, 2002
0.866
+0.362
71.8%
jan 1, 2003
0.61
-0.257
-29.62%
jan 1, 2004
0.536
-0.074
-12.15%
jan 1, 2005
0.504
-0.032
-5.9%
jan 1, 2006
0.595
+0.091
18.15%
jan 1, 2007
0.79
+0.195
32.73%
jan 1, 2008
0.687
-0.103
-13.08%
jan 1, 2009
0.966
+0.279
40.57%
jan 1, 2010
0.844
-0.122
-12.61%
jan 1, 2011
0.479
-0.365
-43.2%
jan 1, 2012
0.773
+0.294
61.26%
jan 1, 2013
1.201
+0.428
55.34%
jan 1, 2014
1.125
-0.076
-6.29%
jan 1, 2015
0.903
-0.223
-19.79%
jan 1, 2016
0.509
-0.393
-43.58%
Ranking of countries by current statistics by years


Comments: