29
/
en
AIzaSyAYiBZKx7MnpbEhh9jyipgxe19OcubqV5w
April 1, 2024
34670
Fragile and conflict affected situations
FCS
false
2
1
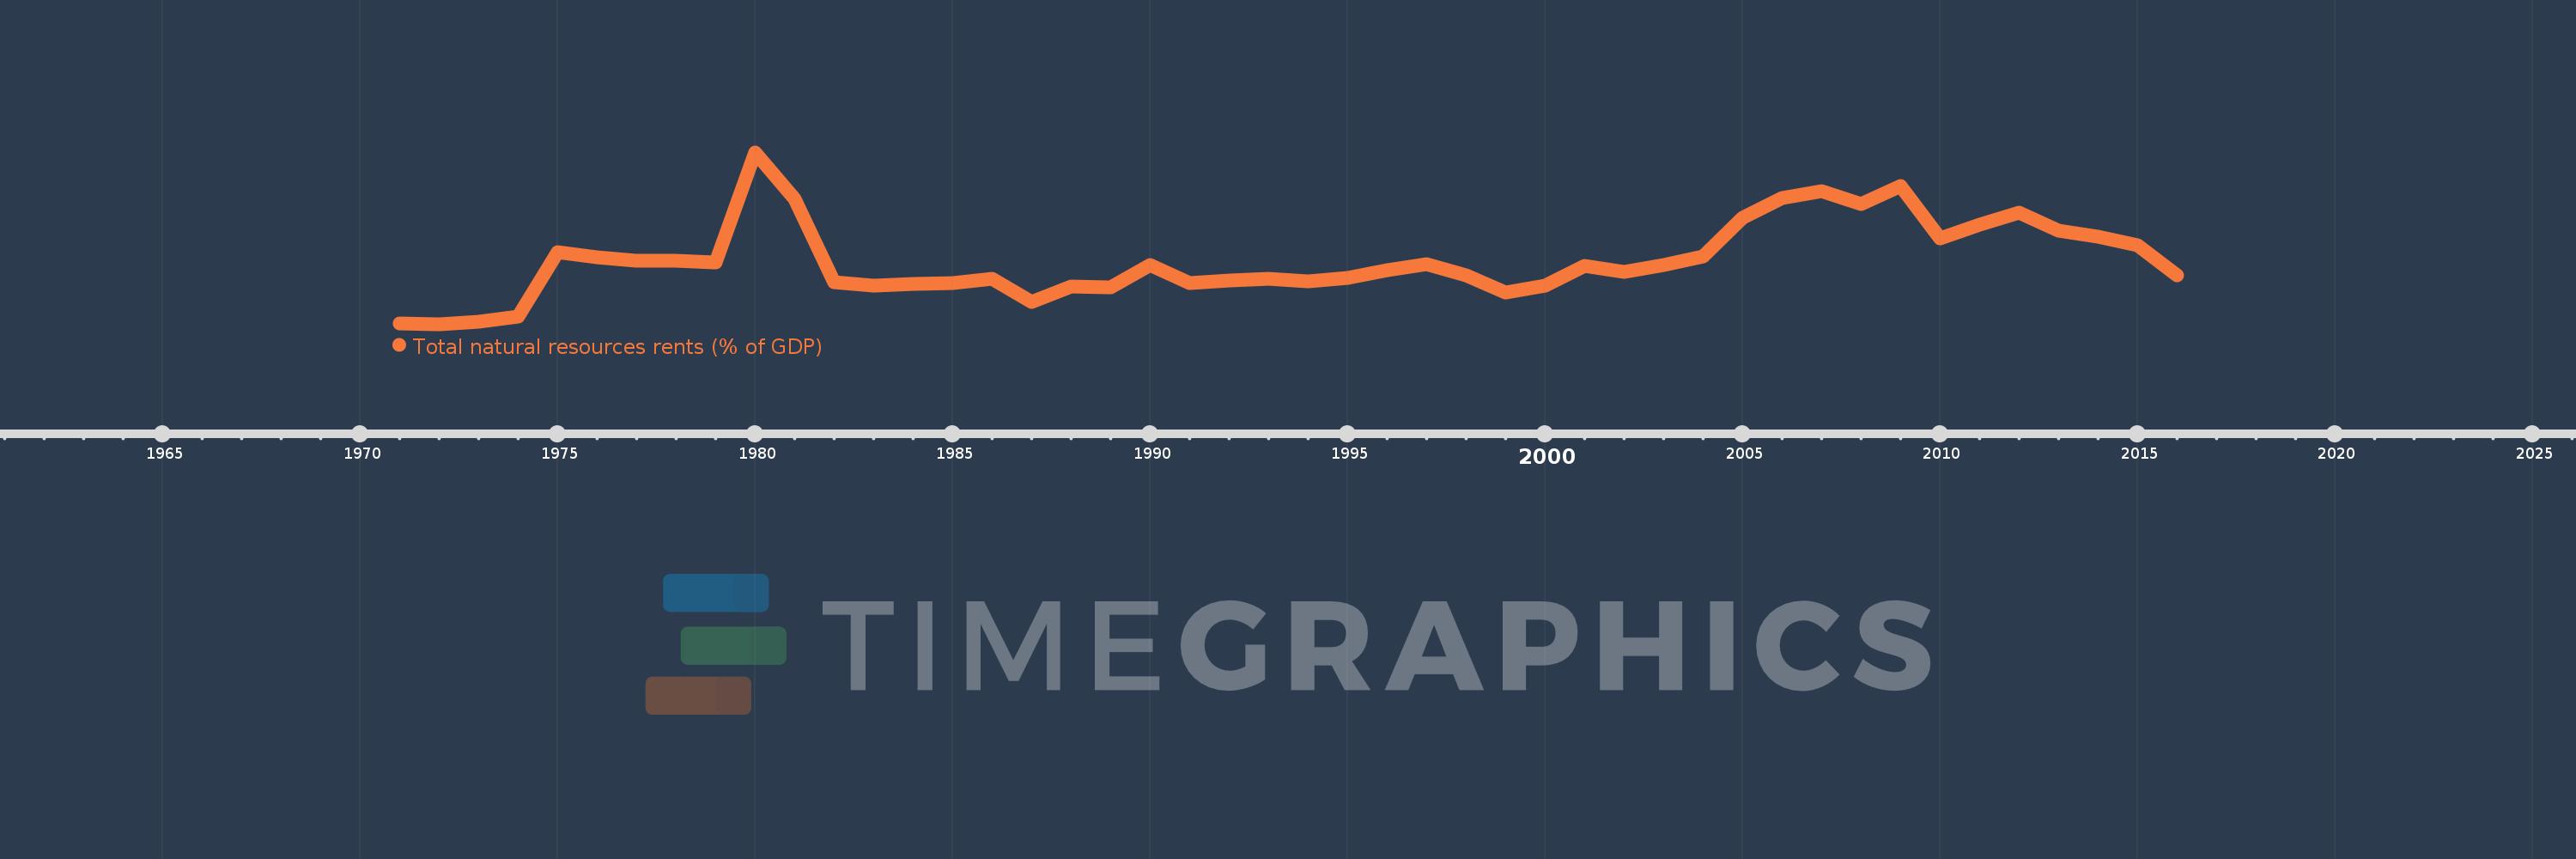
Total natural resources rents (% of GDP)
2016,2015,2014,2013,2012,2011,2010,2009,2008,2007,2006,2005,2004,2003,2002,2001,2000,1999,1998,1997,1996,1995,1994,1993,1992,1991,1990,1989,1988,1987,1986,1985,1984,1983,1982,1981,1980,1979,1978,1977,1976,1975,1974,1973,1972,1971
This statistics in other country:
AfghanistanAlbaniaAlgeriaAngolaArab WorldArgentinaArmeniaArubaAustraliaAustriaAzerbaijanBahamas, TheBahrainBangladeshBarbadosBelarusBelgiumBelizeBeninBhutanBoliviaBosnia and HerzegovinaBotswanaBrazilBrunei DarussalamBulgariaBurkina FasoBurundiCabo VerdeCambodiaCameroonCanadaCaribbean small statesCentral African RepublicCentral Europe and the BalticsChadChileChinaColombiaComorosCongo, Dem. Rep.Congo, Rep.Costa RicaCote d'IvoireCroatiaCubaCyprusCzech RepublicDenmarkDjiboutiDominicaDominican RepublicEarly-demographic dividendEast Asia & PacificEast Asia & Pacific (excluding high income)East Asia & Pacific (IDA & IBRD countries)EcuadorEgypt, Arab Rep.El SalvadorEquatorial GuineaEritreaEstoniaEthiopiaEuro areaEurope & Central AsiaEurope & Central Asia (excluding high income)Europe & Central Asia (IDA & IBRD countries)European UnionFijiFinlandFragile and conflict affected situationsFranceFrench PolynesiaGabonGambia, TheGeorgiaGermanyGhanaGreeceGuatemalaGuineaGuinea-BissauGuyanaHaitiHeavily indebted poor countries (HIPC)High incomeHondurasHong Kong SAR, ChinaHungaryIBRD onlyIcelandIDA & IBRD totalIDA blendIDA onlyIDA totalIndiaIndonesiaIran, Islamic Rep.IraqIrelandIsraelItalyJamaicaJapanJordanKazakhstanKenyaKiribatiKorea, Rep.KuwaitKyrgyz RepublicLao PDRLate-demographic dividendLatin America & Caribbean Latin America & Caribbean (excluding high income)Latin America & the Caribbean (IDA & IBRD countries)LatviaLeast developed countries: UN classificationLebanonLesothoLiberiaLibyaLithuaniaLow & middle incomeLow incomeLower middle incomeLuxembourgMacao SAR, ChinaMacedonia, FYRMadagascarMalawiMalaysiaMaldivesMaliMaltaMauritaniaMauritiusMexicoMiddle East & North AfricaMiddle East & North Africa (excluding high income)Middle East & North Africa (IDA & IBRD countries)Middle incomeMoldovaMongoliaMontenegroMoroccoMozambiqueMyanmarNamibiaNepalNetherlandsNew CaledoniaNew ZealandNicaraguaNigerNigeriaNorth AmericaNorwayOECD membersOmanOther small statesPacific island small statesPakistanPanamaPapua New GuineaParaguayPeruPhilippinesPolandPortugalPost-demographic dividendPre-demographic dividendQatarRomaniaRussian FederationRwandaSamoaSao Tome and PrincipeSaudi ArabiaSenegalSerbiaSeychellesSierra LeoneSingaporeSlovak RepublicSloveniaSmall statesSolomon IslandsSouth AfricaSouth AsiaSouth Asia (IDA & IBRD)South SudanSpainSri LankaSt. LuciaSt. Vincent and the GrenadinesSub-Saharan Africa Sub-Saharan Africa (excluding high income)Sub-Saharan Africa (IDA & IBRD countries)SudanSurinameSwazilandSwedenSwitzerlandSyrian Arab RepublicTajikistanTanzaniaThailandTimor-LesteTogoTongaTrinidad and TobagoTunisiaTurkeyTurkmenistanUgandaUkraineUnited Arab EmiratesUnited KingdomUnited StatesUpper middle incomeUruguayUzbekistanVanuatuVenezuela, RBVietnamWorldYemen, Rep.ZambiaZimbabwe Timeline:
This timeline shows a graph from 1971 to 2016 of Fragile and conflict affected situations. No data until 1970. Number of actual observations by date: 46.
Source name:
World Development Indicators
Source organization:
Estimates based on sources and methods described in "The Changing Wealth of Nations: Measuring Sustainable Development in the New Millennium" (World Bank, 2011).
Categories, topics:
Energy & Mining, Environment
Last updated:
apr 23, 2017
Indicators value changes by year
Maximum:
45.784
jan 1, 1980
At the date of observation
Value
Absolute change
Change from previous value
jan 1, 1971
2.669
+2.669
0.0%
jan 1, 1972
2.478
-0.191
-7.16%
jan 1, 1973
3.181
+0.703
28.35%
jan 1, 1974
4.432
+1.252
39.35%
jan 1, 1975
20.653
+16.221
365.98%
jan 1, 1976
19.328
-1.325
-6.42%
jan 1, 1977
18.535
-0.793
-4.1%
jan 1, 1978
18.401
-0.134
-0.73%
jan 1, 1979
18.002
-0.399
-2.17%
jan 1, 1980
45.784
+27.783
154.34%
jan 1, 1981
33.965
-11.819
-25.82%
jan 1, 1982
13.051
-20.914
-61.57%
jan 1, 1983
12.101
-0.95
-7.28%
jan 1, 1984
12.581
+0.48
3.97%
jan 1, 1985
12.765
+0.184
1.46%
jan 1, 1986
13.928
+1.163
9.11%
jan 1, 1987
8.104
-5.825
-41.82%
jan 1, 1988
11.951
+3.847
47.48%
jan 1, 1989
11.727
-0.225
-1.88%
jan 1, 1990
17.393
+5.666
48.32%
jan 1, 1991
12.904
-4.489
-25.81%
jan 1, 1992
13.436
+0.531
4.12%
jan 1, 1993
13.996
+0.56
4.17%
jan 1, 1994
13.263
-0.733
-5.24%
jan 1, 1995
14.196
+0.933
7.03%
jan 1, 1996
16.154
+1.958
13.79%
jan 1, 1997
17.576
+1.422
8.8%
jan 1, 1998
14.734
-2.843
-16.17%
jan 1, 1999
10.547
-4.186
-28.41%
jan 1, 2000
12.256
+1.709
16.2%
jan 1, 2001
17.168
+4.912
40.08%
jan 1, 2002
15.681
-1.487
-8.66%
jan 1, 2003
17.463
+1.782
11.36%
jan 1, 2004
19.586
+2.123
12.16%
jan 1, 2005
29.372
+9.785
49.96%
jan 1, 2006
34.366
+4.994
17.0%
jan 1, 2007
36.03
+1.664
4.84%
jan 1, 2008
32.77
-3.261
-9.05%
jan 1, 2009
37.257
+4.487
13.69%
jan 1, 2010
24.031
-13.226
-35.5%
jan 1, 2011
27.619
+3.588
14.93%
jan 1, 2012
30.511
+2.892
10.47%
jan 1, 2013
26.067
-4.443
-14.56%
jan 1, 2014
24.468
-1.6
-6.14%
jan 1, 2015
22.38
-2.088
-8.53%
jan 1, 2016
14.833
-7.547
-33.72%
Ranking of countries by current statistics by years


Comments: