29
/
en
AIzaSyAYiBZKx7MnpbEhh9jyipgxe19OcubqV5w
April 1, 2024
193753
Mauritania
MRT
true
2
1
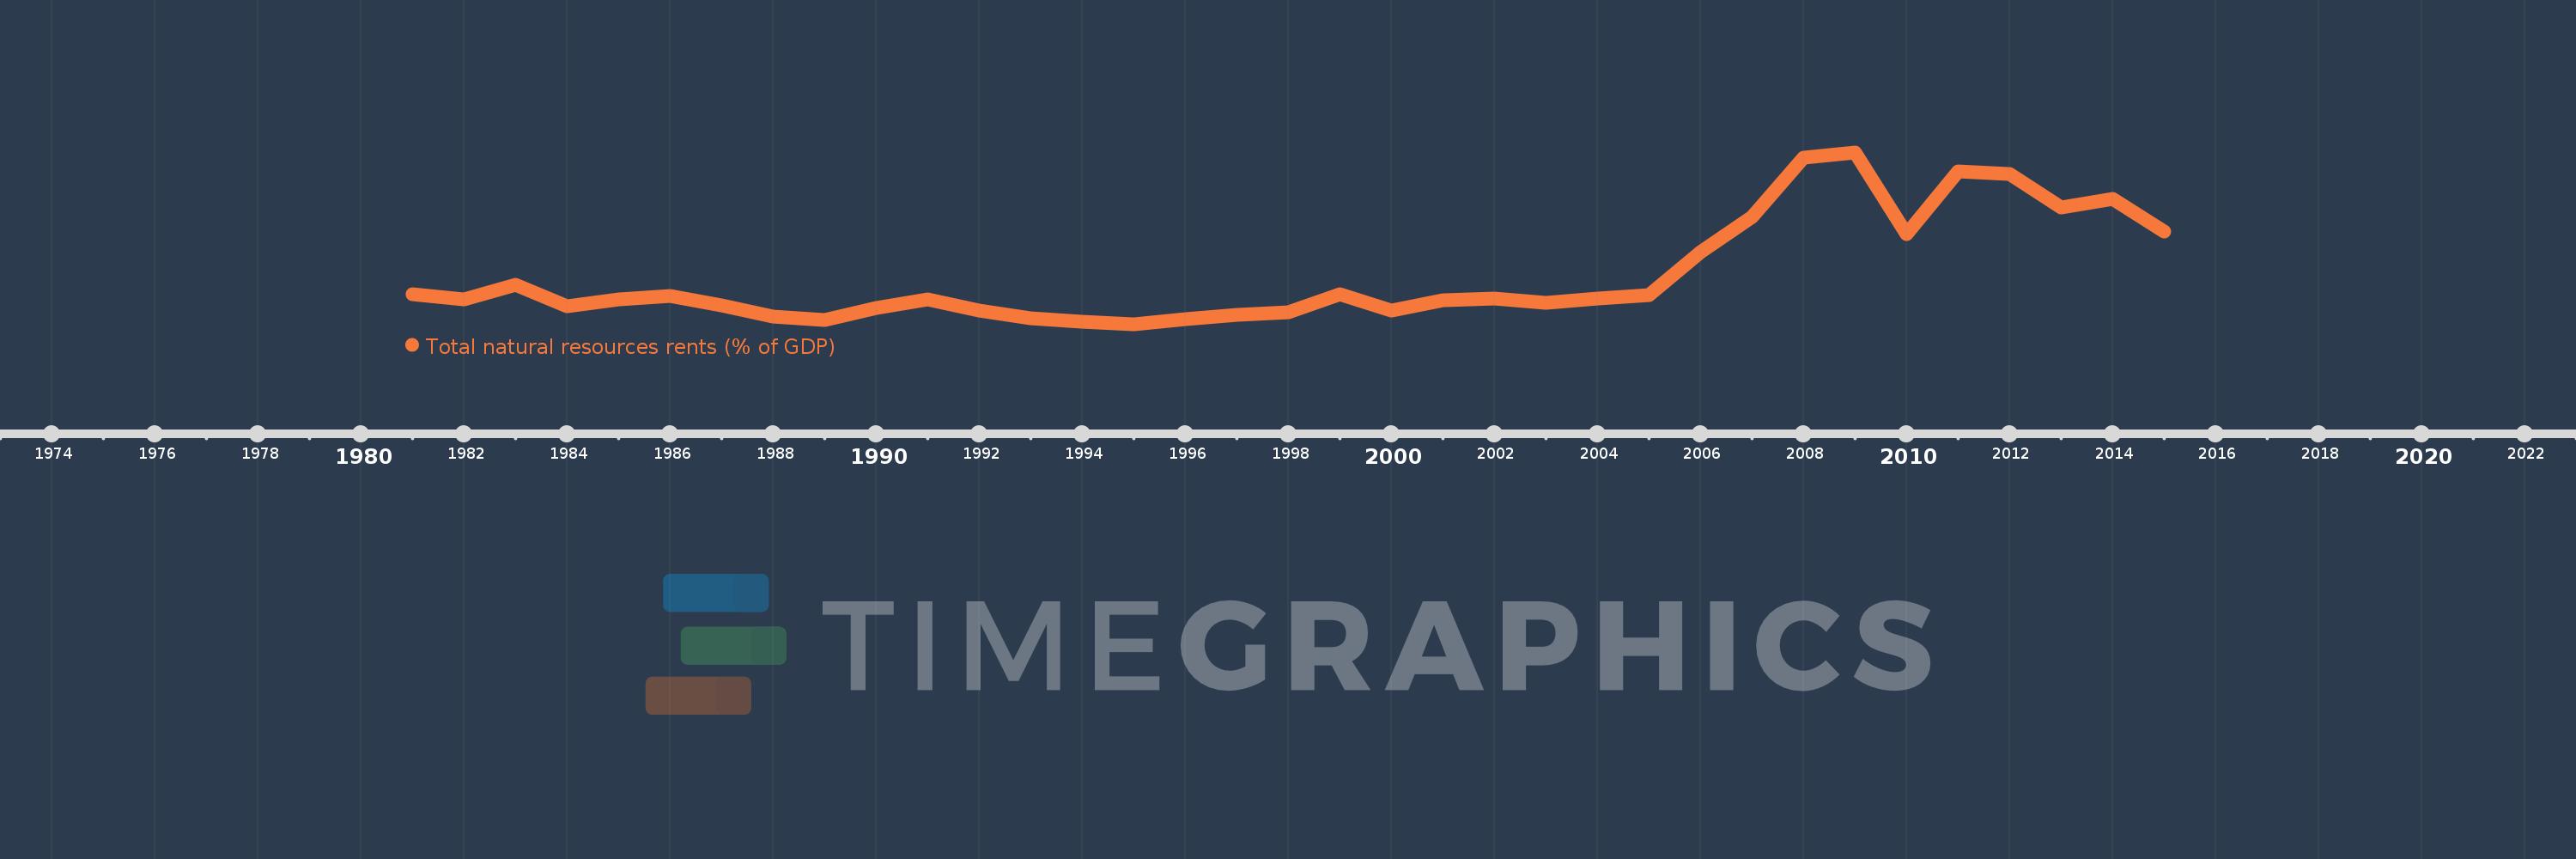
Total natural resources rents (% of GDP)
2015,2014,2013,2012,2011,2010,2009,2008,2007,2006,2005,2004,2003,2002,2001,2000,1999,1998,1997,1996,1995,1994,1993,1992,1991,1990,1989,1988,1987,1986,1985,1984,1983,1982,1981
This statistics in other country:
AfghanistanAlbaniaAlgeriaAngolaArab WorldArgentinaArmeniaArubaAustraliaAustriaAzerbaijanBahamas, TheBahrainBangladeshBarbadosBelarusBelgiumBelizeBeninBhutanBoliviaBosnia and HerzegovinaBotswanaBrazilBrunei DarussalamBulgariaBurkina FasoBurundiCabo VerdeCambodiaCameroonCanadaCaribbean small statesCentral African RepublicCentral Europe and the BalticsChadChileChinaColombiaComorosCongo, Dem. Rep.Congo, Rep.Costa RicaCote d'IvoireCroatiaCubaCyprusCzech RepublicDenmarkDjiboutiDominicaDominican RepublicEarly-demographic dividendEast Asia & PacificEast Asia & Pacific (excluding high income)East Asia & Pacific (IDA & IBRD countries)EcuadorEgypt, Arab Rep.El SalvadorEquatorial GuineaEritreaEstoniaEthiopiaEuro areaEurope & Central AsiaEurope & Central Asia (excluding high income)Europe & Central Asia (IDA & IBRD countries)European UnionFijiFinlandFragile and conflict affected situationsFranceFrench PolynesiaGabonGambia, TheGeorgiaGermanyGhanaGreeceGuatemalaGuineaGuinea-BissauGuyanaHaitiHeavily indebted poor countries (HIPC)High incomeHondurasHong Kong SAR, ChinaHungaryIBRD onlyIcelandIDA & IBRD totalIDA blendIDA onlyIDA totalIndiaIndonesiaIran, Islamic Rep.IraqIrelandIsraelItalyJamaicaJapanJordanKazakhstanKenyaKiribatiKorea, Rep.KuwaitKyrgyz RepublicLao PDRLate-demographic dividendLatin America & Caribbean Latin America & Caribbean (excluding high income)Latin America & the Caribbean (IDA & IBRD countries)LatviaLeast developed countries: UN classificationLebanonLesothoLiberiaLibyaLithuaniaLow & middle incomeLow incomeLower middle incomeLuxembourgMacao SAR, ChinaMacedonia, FYRMadagascarMalawiMalaysiaMaldivesMaliMaltaMauritaniaMauritiusMexicoMiddle East & North AfricaMiddle East & North Africa (excluding high income)Middle East & North Africa (IDA & IBRD countries)Middle incomeMoldovaMongoliaMontenegroMoroccoMozambiqueMyanmarNamibiaNepalNetherlandsNew CaledoniaNew ZealandNicaraguaNigerNigeriaNorth AmericaNorwayOECD membersOmanOther small statesPacific island small statesPakistanPanamaPapua New GuineaParaguayPeruPhilippinesPolandPortugalPost-demographic dividendPre-demographic dividendQatarRomaniaRussian FederationRwandaSamoaSao Tome and PrincipeSaudi ArabiaSenegalSerbiaSeychellesSierra LeoneSingaporeSlovak RepublicSloveniaSmall statesSolomon IslandsSouth AfricaSouth AsiaSouth Asia (IDA & IBRD)South SudanSpainSri LankaSt. LuciaSt. Vincent and the GrenadinesSub-Saharan Africa Sub-Saharan Africa (excluding high income)Sub-Saharan Africa (IDA & IBRD countries)SudanSurinameSwazilandSwedenSwitzerlandSyrian Arab RepublicTajikistanTanzaniaThailandTimor-LesteTogoTongaTrinidad and TobagoTunisiaTurkeyTurkmenistanUgandaUkraineUnited Arab EmiratesUnited KingdomUnited StatesUpper middle incomeUruguayUzbekistanVanuatuVenezuela, RBVietnamWorldYemen, Rep.ZambiaZimbabwe Timeline:
This timeline shows a graph from 1981 to 2015 of Mauritania. No data until 1980. Number of actual observations by date: 35.
Source name:
World Development Indicators
Source organization:
Estimates based on sources and methods described in "The Changing Wealth of Nations: Measuring Sustainable Development in the New Millennium" (World Bank, 2011).
Categories, topics:
Energy & Mining, Environment
Last updated:
apr 23, 2017
Indicators value changes by year
Maximum:
54.075
jan 1, 2009
At the date of observation
Value
Absolute change
Change from previous value
jan 1, 1981
14.304
+14.304
0.0%
jan 1, 1982
12.739
-1.565
-10.94%
jan 1, 1983
16.777
+4.038
31.7%
jan 1, 1984
10.798
-5.979
-35.64%
jan 1, 1985
12.833
+2.034
18.84%
jan 1, 1986
13.812
+0.98
7.63%
jan 1, 1987
10.977
-2.835
-20.53%
jan 1, 1988
8.003
-2.974
-27.09%
jan 1, 1989
6.906
-1.097
-13.71%
jan 1, 1990
10.317
+3.411
49.4%
jan 1, 1991
12.672
+2.354
22.82%
jan 1, 1992
9.536
-3.135
-24.74%
jan 1, 1993
7.4
-2.137
-22.41%
jan 1, 1994
6.429
-0.971
-13.12%
jan 1, 1995
5.808
-0.62
-9.65%
jan 1, 1996
7.301
+1.492
25.69%
jan 1, 1997
8.331
+1.03
14.11%
jan 1, 1998
9.154
+0.823
9.88%
jan 1, 1999
14.26
+5.106
55.78%
jan 1, 2000
9.597
-4.664
-32.71%
jan 1, 2001
12.483
+2.886
30.08%
jan 1, 2002
12.941
+0.458
3.67%
jan 1, 2003
11.865
-1.077
-8.32%
jan 1, 2004
13.065
+1.201
10.12%
jan 1, 2005
14.081
+1.016
7.77%
jan 1, 2006
25.95
+11.869
84.29%
jan 1, 2007
35.849
+9.899
38.15%
jan 1, 2008
52.503
+16.654
46.46%
jan 1, 2009
54.075
+1.572
2.99%
jan 1, 2010
31.144
-22.931
-42.41%
jan 1, 2011
48.766
+17.622
56.58%
jan 1, 2012
47.967
-0.798
-1.64%
jan 1, 2013
38.688
-9.279
-19.34%
jan 1, 2014
41.068
+2.38
6.15%
jan 1, 2015
31.798
-9.27
-22.57%
Ranking of countries by current statistics by years


Comments: